
EPISODE · Jun 29, 2026 · 22 MIN
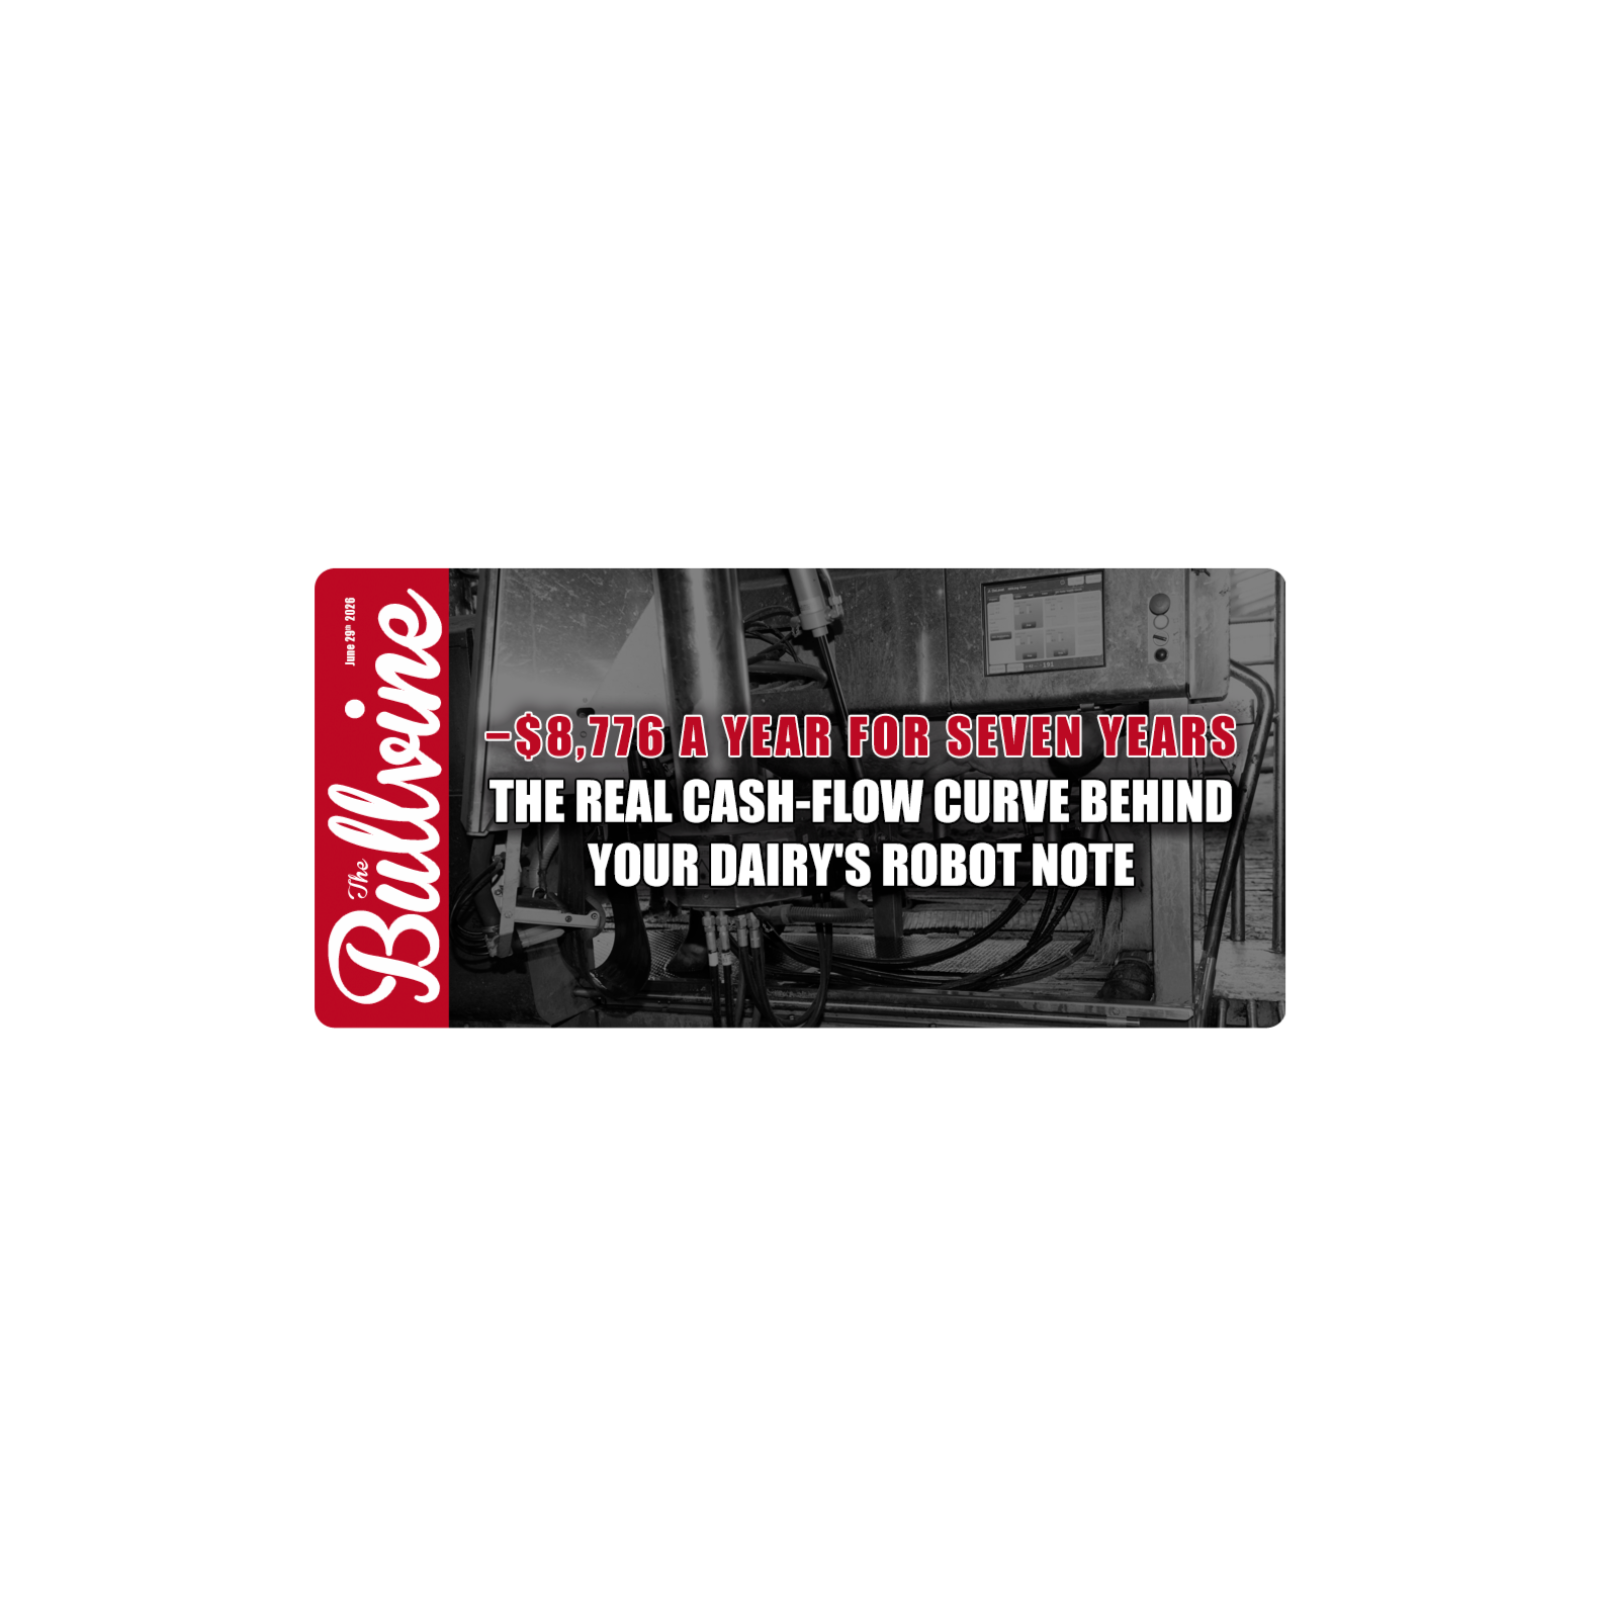
E600 −$8,776 a Year for Seven Years: The Real Cash-Flow Curve Behind Your Dairy’s Robot Note
from The Bullvine
86% of robot owners are happy. Only 28% turn a profit. Those numbers aren't a contradiction — they measure two different things, and the gap can cost you years of red ink.The Bullvine Podcast pulls apart the milking robot's real economics. We walk through Iowa State economist Larry Tranel's cash-flow model — a seven-year valley running about $8,776 a year in the red before it turns positive — and line the dealer's three-year payback pitch against the university math. Plus what changes under Canada's quota system.What You'll LearnWhy a $400,000 install runs $8,776/year in the red for seven yearsHow $1.50/cwt in labor savings gets swamped by $2.60–$3.99/cwt in debt serviceWhy the dealer's 5–10% milk bump is really 3–5% — near zero if you're already on 3xThe $27.05/hour labor wage where robots finally break evenWhy fat-per-box, not headcount, drives the math for quota-system farmsThe DSCR and $18-milk stress tests to run before you signUSDA's January 2026 ERR-356 report found box robots lift dairy net returns 13%, about $3.15/cwt — but that average hides a brutal early stretch. On a mid-size family herd, an $80,000 robot payment can drop your debt-service coverage from a comfortable 1.30x to a lender-spooking 0.93x. This episode hands you the thresholds to decide whether you're buying margin or just financing a lifestyle.Full article and sources: https://www.thebullvine.com/management/robotic-milking/robotic-milking-roi-cash-flow-valley/ Subscribe for straight-talking dairy analysis. Share this with a producer who needs it.
Embed this episode
NOW PLAYING
E600 −$8,776 a Year for Seven Years: The Real Cash-Flow Curve Behind Your Dairy’s Robot Note
No transcript for this episode yet
Similar Episodes
No similar episodes found.
Similar Podcasts
No similar podcasts found.