
EPISODE · Jul 17, 2026 · 13 MIN
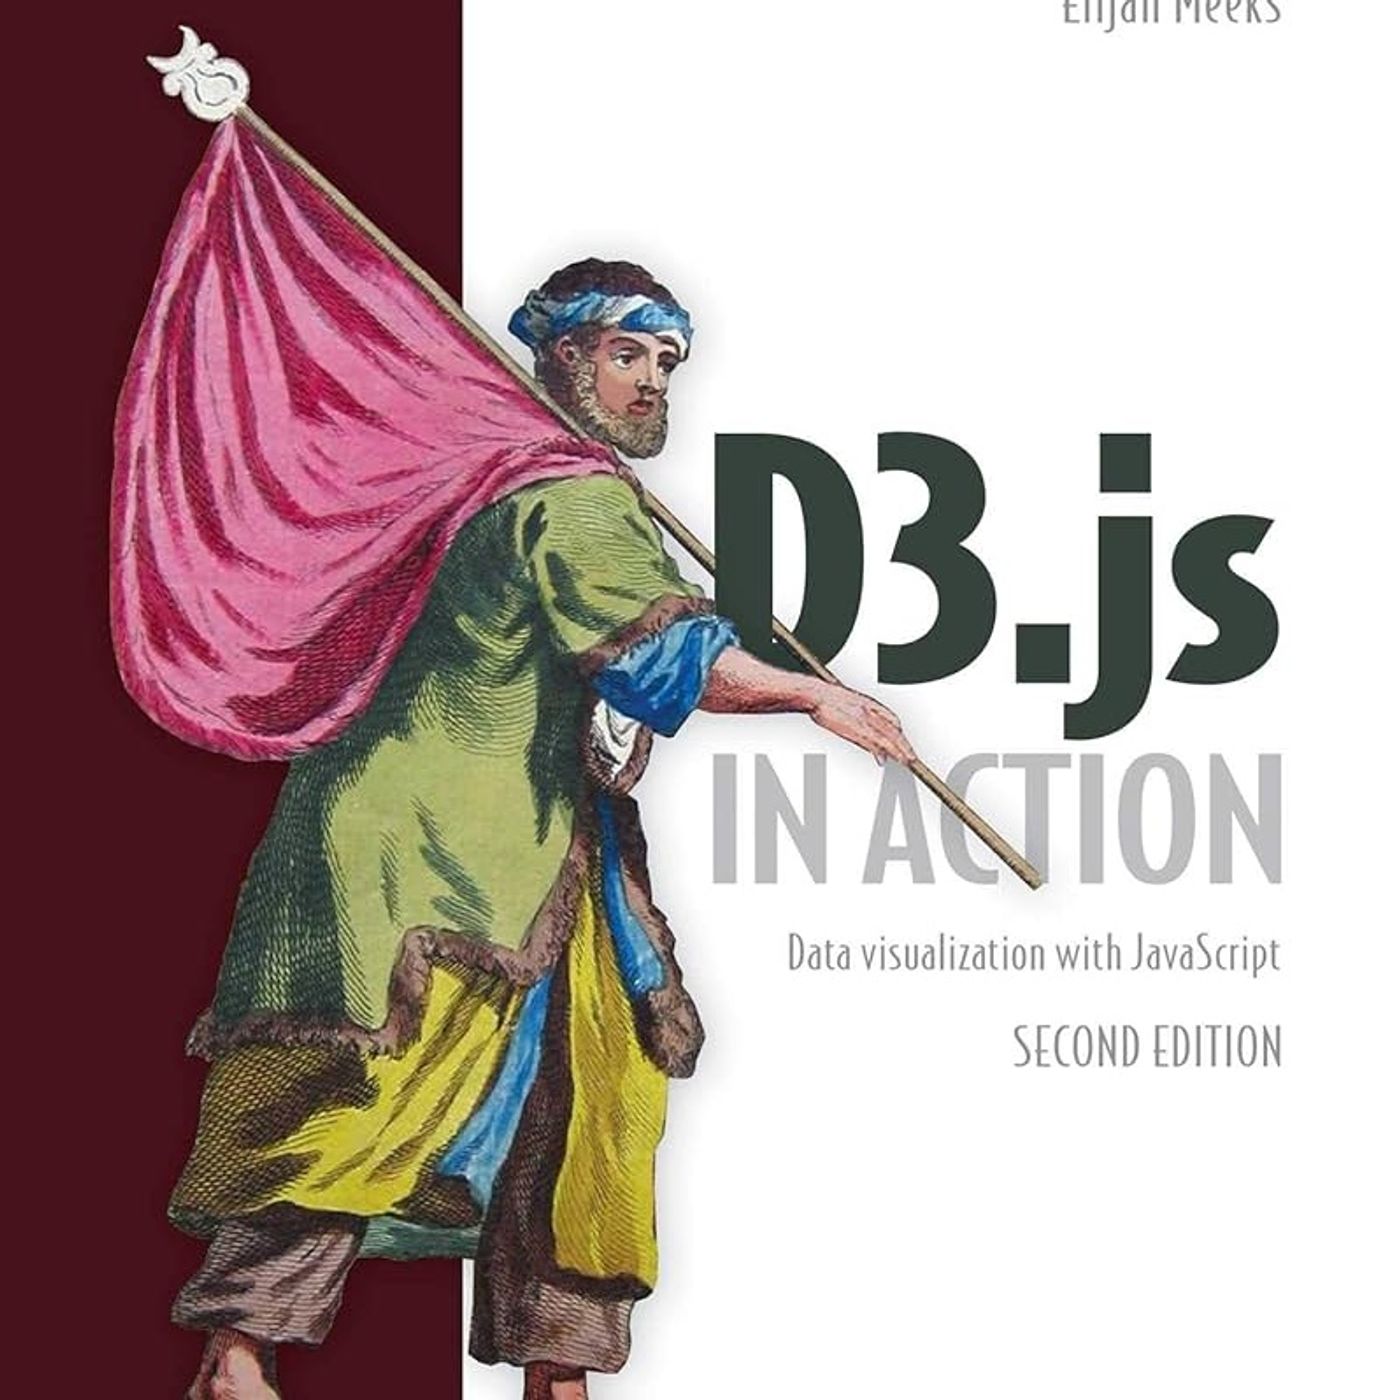
D3.js in Action: Data visualization with JavaScript
from CyberSecurity Summary · host CyberSecurity Summary
Provides an educational overview of the D3.js library for data visualization. The text explains that D3 stands for Data-Driven Documents, a toolset used to bind digital information to the Document Object Model to create interactive web content. It highlights the library's versatility in generating everything from standard charts to complex geospatial maps and network diagrams. The material details fundamental web technologies like SVG, HTML5, and CSS, which serve as the building blocks for these visualizations. By utilizing selections and data-binding, developers can derive the appearance of page elements directly from their datasets. Ultimately, the source serves as a guide for building performant, interactive dashboards within a modern JavaScript ecosystem. You can listen and download our episodes for free on more than 10 different platforms: https://linktr.ee/cyber_security_summary Get the Book now from Amazon: https://www.amazon.com/D3-js-Action-Data-visualization-JavaScript-ebook/dp/B09782NT3P?&linkCode=ll2&tag=cvthunderx-20&linkId=df34289c89b17dcf0da9d96e4d821bd4&language=en_US&ref_=as_li_ss_tl Discover our free courses in tech and cybersecurity, Start learning today: https://linktr.ee/cybercode_academy
Embed this episode
Ready to play
D3.js in Action: Data visualization with JavaScript
No transcript for this episode yet
Similar Episodes
No similar episodes found.