
EPISODE · Aug 6, 2026 · 20 MIN
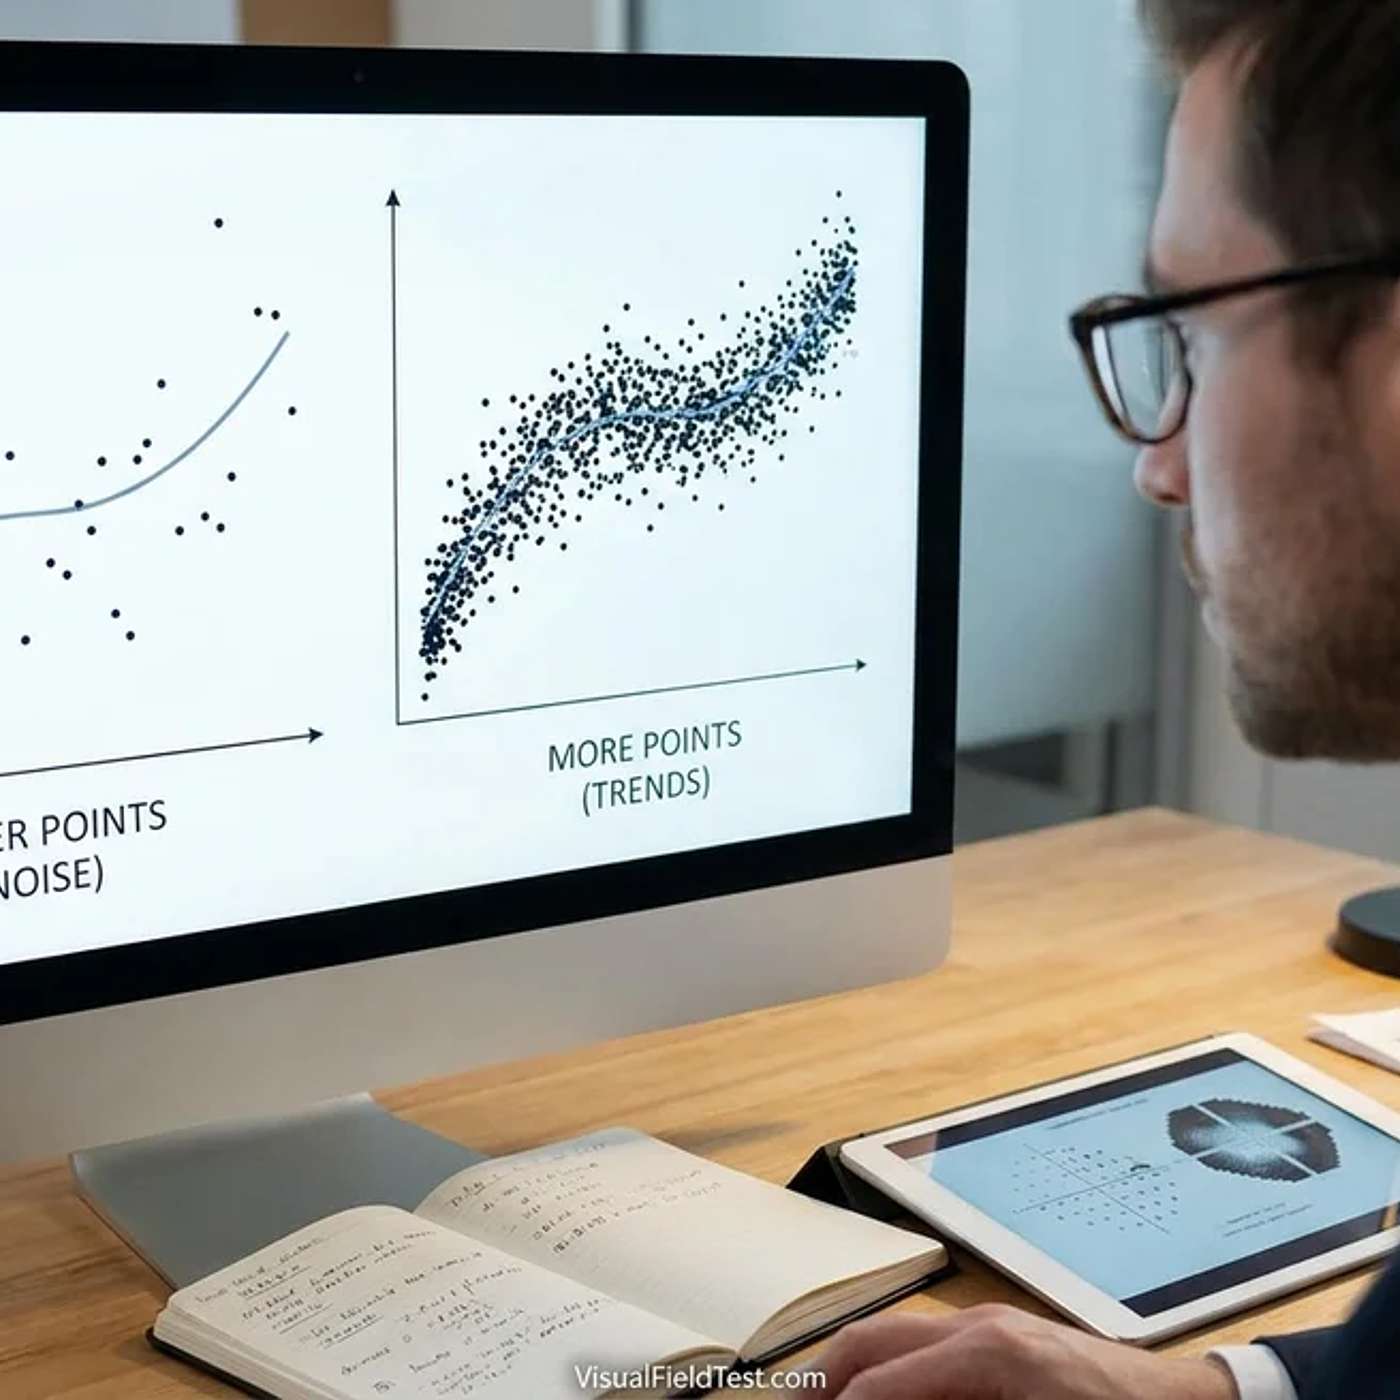
Do More Data Points Reveal Clearer Trends? Power and Noise in VF Progression
from Glaucoma, Vision & Longevity: Supplements & Science · host Visual Field Test
This audio article is from VisualFieldTest.com.Read the full article here: https://visualfieldtest.com/en/do-more-data-points-reveal-clearer-trends-power-and-noise-in-vf-progressionTest your visual field online: https://visualfieldtest.comSupport the show so new episodes keep coming: https://www.buzzsprout.com/2563091/supportExcerpt:Do More Data Points Reveal Clearer Trends? Power and Noise in Visual Field Progression Introduction In glaucoma, visual field testing is used to determine whether vision is stable or gradually worsening. The challenge is that each test contains some noise. Attention, fatigue, learning, cataract, dry eye, fixation, and the patient’s underlying level of damage can all affect the result. Testing more often usually makes a true trend easier to recognize. However, the benefit is not proportional. Moving from one test per year to two often provides a meaningful gain. Moving from two to three tests per year may help, but the additional benefit is smaller. Testing too often can also create more apparent “changes” that later disappear, especially when statistical thresholds are applied repeatedly. The practical goal is therefore not to collect the largest possible number of visual fields. It is to collect enough high-quality tests, spaced appropriately, to detect clinically important progression without creating unnecessary burden or false alarms. Current glaucoma guidance supports at least annual testing for established glaucoma, with more frequent testing during the first two years after diagnosis or when the risk of rapid progression is high. () Why visual field progression is difficult to detect A visual field test measures light sensitivity at many locations. The result is not a direct photograph of the optic nerve. It is a behavioral measurement that depends on the patient noticing and responding to visual stimuli. A simple way to describe a visual field series is: > Observed result = true visual function + measurement noise The true glaucoma signal may be a gradual decline of only a fraction of a decibel per year, while the variation between individual tests can be several decibels at some locations. Test–retest variability tends to be greater in eyes with more advanced damage, lower sensitivity, peripheral defects, and certain defect patterns. () Mean deviation Mean deviation is a single summary number describing the overall visual field compared with an age-adjusted normal field. A negative number indicates loss; a more negative number indicates greater overall loss. Mean deviation is useful because it averages information across the field and is relatively easy to follow over time. A clinician can plot mean deviation against time and calculate a slope, such as: −0.3 decibels per year: slow change −1.0 decibel per year: moderate change −2.0 decibels per year: rapid change However, mean deviation can miss localized progression if the damaged area is small. It can also be influenced by diffuse factors such as cataract or other media opacity. () Pointwise slopes Pointwise linear regression evaluates each test location separately. It can show that a particular cluster of locations is worsening at, for example, −1.2 decibels per year. This approach can detect localized or paracentral progression that is diluted within a whole-field average. Its disadvantages are that individual locations are noisier than the overall mean, many locations are tested simultaneously, and the chance of at least one apparently significant result increases as more locations and more visits are examined. () How increasing test frequency improves signal-to-noise For a trend analysis, additional tests help in two ways: They provide more observations, reducing uncertainty about the estimated slope. They show whether a change is persistent, rather than a single unusually poor result. The timing of the tests also matters. A slope is estimated more precisely when tests are distributed across a longer time span. Three tests performed within a few weeks provide a better estimate of short-term repeatability, but three tests spaced over a year provide more information about long-term decline. This is why two baseline tests close together can be useful for learning and repeatability, while later tests should usually be spread across the follow-up period. The European Glaucoma Society emphasizes that determining an individual rate of progression generally requires at least two years and enough reliable visual fields. () Simulation evidence: the largest gains occur early Mean deviation: one versus two versus three tests per year Wu and colleagues used real visual field variability from 1,072 eyes and reconstructed visual field series through computer simulation. Their analysis required two baseline tests and a confirmatory test before progression was counted. The estimated time required to detect progression in 80% of eyes was: () For the full table, please open this article on visualfieldtest.com. These results show two important principles: Increasing testing from once to twice yearly produced a substantial improvement. Increasing testing from twice to three times yearly produced a smaller improvement. For a rapidly progressing eye losing −2.0 decibels per year, moving from annual to six-monthly testing shortened modeled detection time by approximately 0.9 years. Moving from six-monthly to four-monthly testing shortened it by only about 0.3 years. For a slower eye losing −0.5 decibels per year, even three tests per year required approximately five years to achieve 80% detection power. More frequent testing helps, but it cannot completely overcome a very small signal or high measurement variability. () An earlier practical analysis reached a similar conclusion. For an eye with average variability, approximately three tests per year were estimated to be needed to detect a four-decibel mean deviation decline over two years with 80% power. The authors recommended six reliable examinations during the first two years to establish a baseline and identify unusually rapid progression. () Pointwise slopes: greater sensitivity, but more false alarms Gardiner and Crabb developed a “virtual eye” simulation in which a test location was either stable or deteriorating at a known rate. When a location was truly worsening at 2 decibels per year, more frequent testing allowed pointwise linear regression to identify progression sooner. But when the simulated location was stable, increasing test frequency also increased the number of series falsely labeled as progressing during the early years. Their conclusion was that three tests per year provided a practical compromise between sensitivity and specificity for pointwise linear regression. () This is an important qualification: more data improve the chance of detecting a real trend, but they also create more opportunities to observe an unusual sequence of results. Statistical methods therefore need confirmation rules and appropriate thresholds. What real-world visual field series show The Advanced Glaucoma Intervention Study Nouri-Mahdavi and colleagues analyzed 468 eyes from the Advanced Glaucoma Intervention Study. They compared the original, more frequent visual field series with a version in which approximately half of the later tests had been removed. The high-frequency series had a median interval of about six months, compared with approximately 11.3 months in the lower-frequency series. Progression based on mean deviation was detected in: 43.6% of eyes with the more frequent series 34.2% of eyes with the less frequent series Using pointwise linear regression, progression was detected in: 39.5% of eyes with the more frequent series 35.7% of eyes with the less frequent series The hazard of detecting mean deviation progression was 1.69 times higher with more frequent testing. For pointwise linear regression, the hazard was 1.52 times higher. The benefit was particularly evident with global mean deviation analysis. () This real-world analysis supports the simulation findings: six-monthly testing generally detects progression earlier than approximately annual testing, but the gain is larger for mean deviation than for pointwise slopes. Real-world testing in the United States A more recent study used real-world visual field variability from the Duke Glaucoma Registry and simulated progression at testing frequencies observed in a large United States insured population. For modeled progression rates of −0.5 or −1.0 decibels per year, the time required to detect progression in 80% of eyes was estimated as follows: () For the full table, please open this article on visualfieldtest.com. These numbers are modeled estimates, not a prediction for every patient. They nevertheless demonstrate how infrequent testing can delay recognition of progression for many years. The study also found that more than three-quarters of patients in the underlying nationwide cohort received fewer than one visual field test per year. () Frontloading tests A 2024 simulation study used progression rates and baseline characteristics from Swedish and Canadian glaucoma cohorts. It compared one visual field test per visit with a “frontloaded” strategy involving two tests per visit. When visits occurred every six months, frontloading detected progression approximately one to one-and-a-half years earlier in many scenarios. At four years, it increased the proportion of detected progressors by roughly 27% to 32%, depending on the amount of missing data. The simulated eyes also had less visual field loss when progression was detected. () FrontSupport the show
Embed this episode
What this episode covers
This audio article is from VisualFieldTest.com. Read the full article here: https://visualfieldtest.com/en/do-more-data-points-reveal-clearer-trends-power-and-noise-in-vf-progression Test your visual field online: https://visualfieldtest.com Support the show so new episodes keep coming: https://www.buzzsprout.com/2563091/support Excerpt: Do More Data Points Reveal Clearer Trends? Power and Noise in Visual Field Progression Introduction In glaucoma, visual field testing is used to determine wh...
Ready to play
Do More Data Points Reveal Clearer Trends? Power and Noise in VF Progression
No transcript for this episode yet
Similar Episodes
No similar episodes found.
Similar Podcasts
No similar podcasts found.