
EPISODE · Jul 30, 2022 · 28 MIN
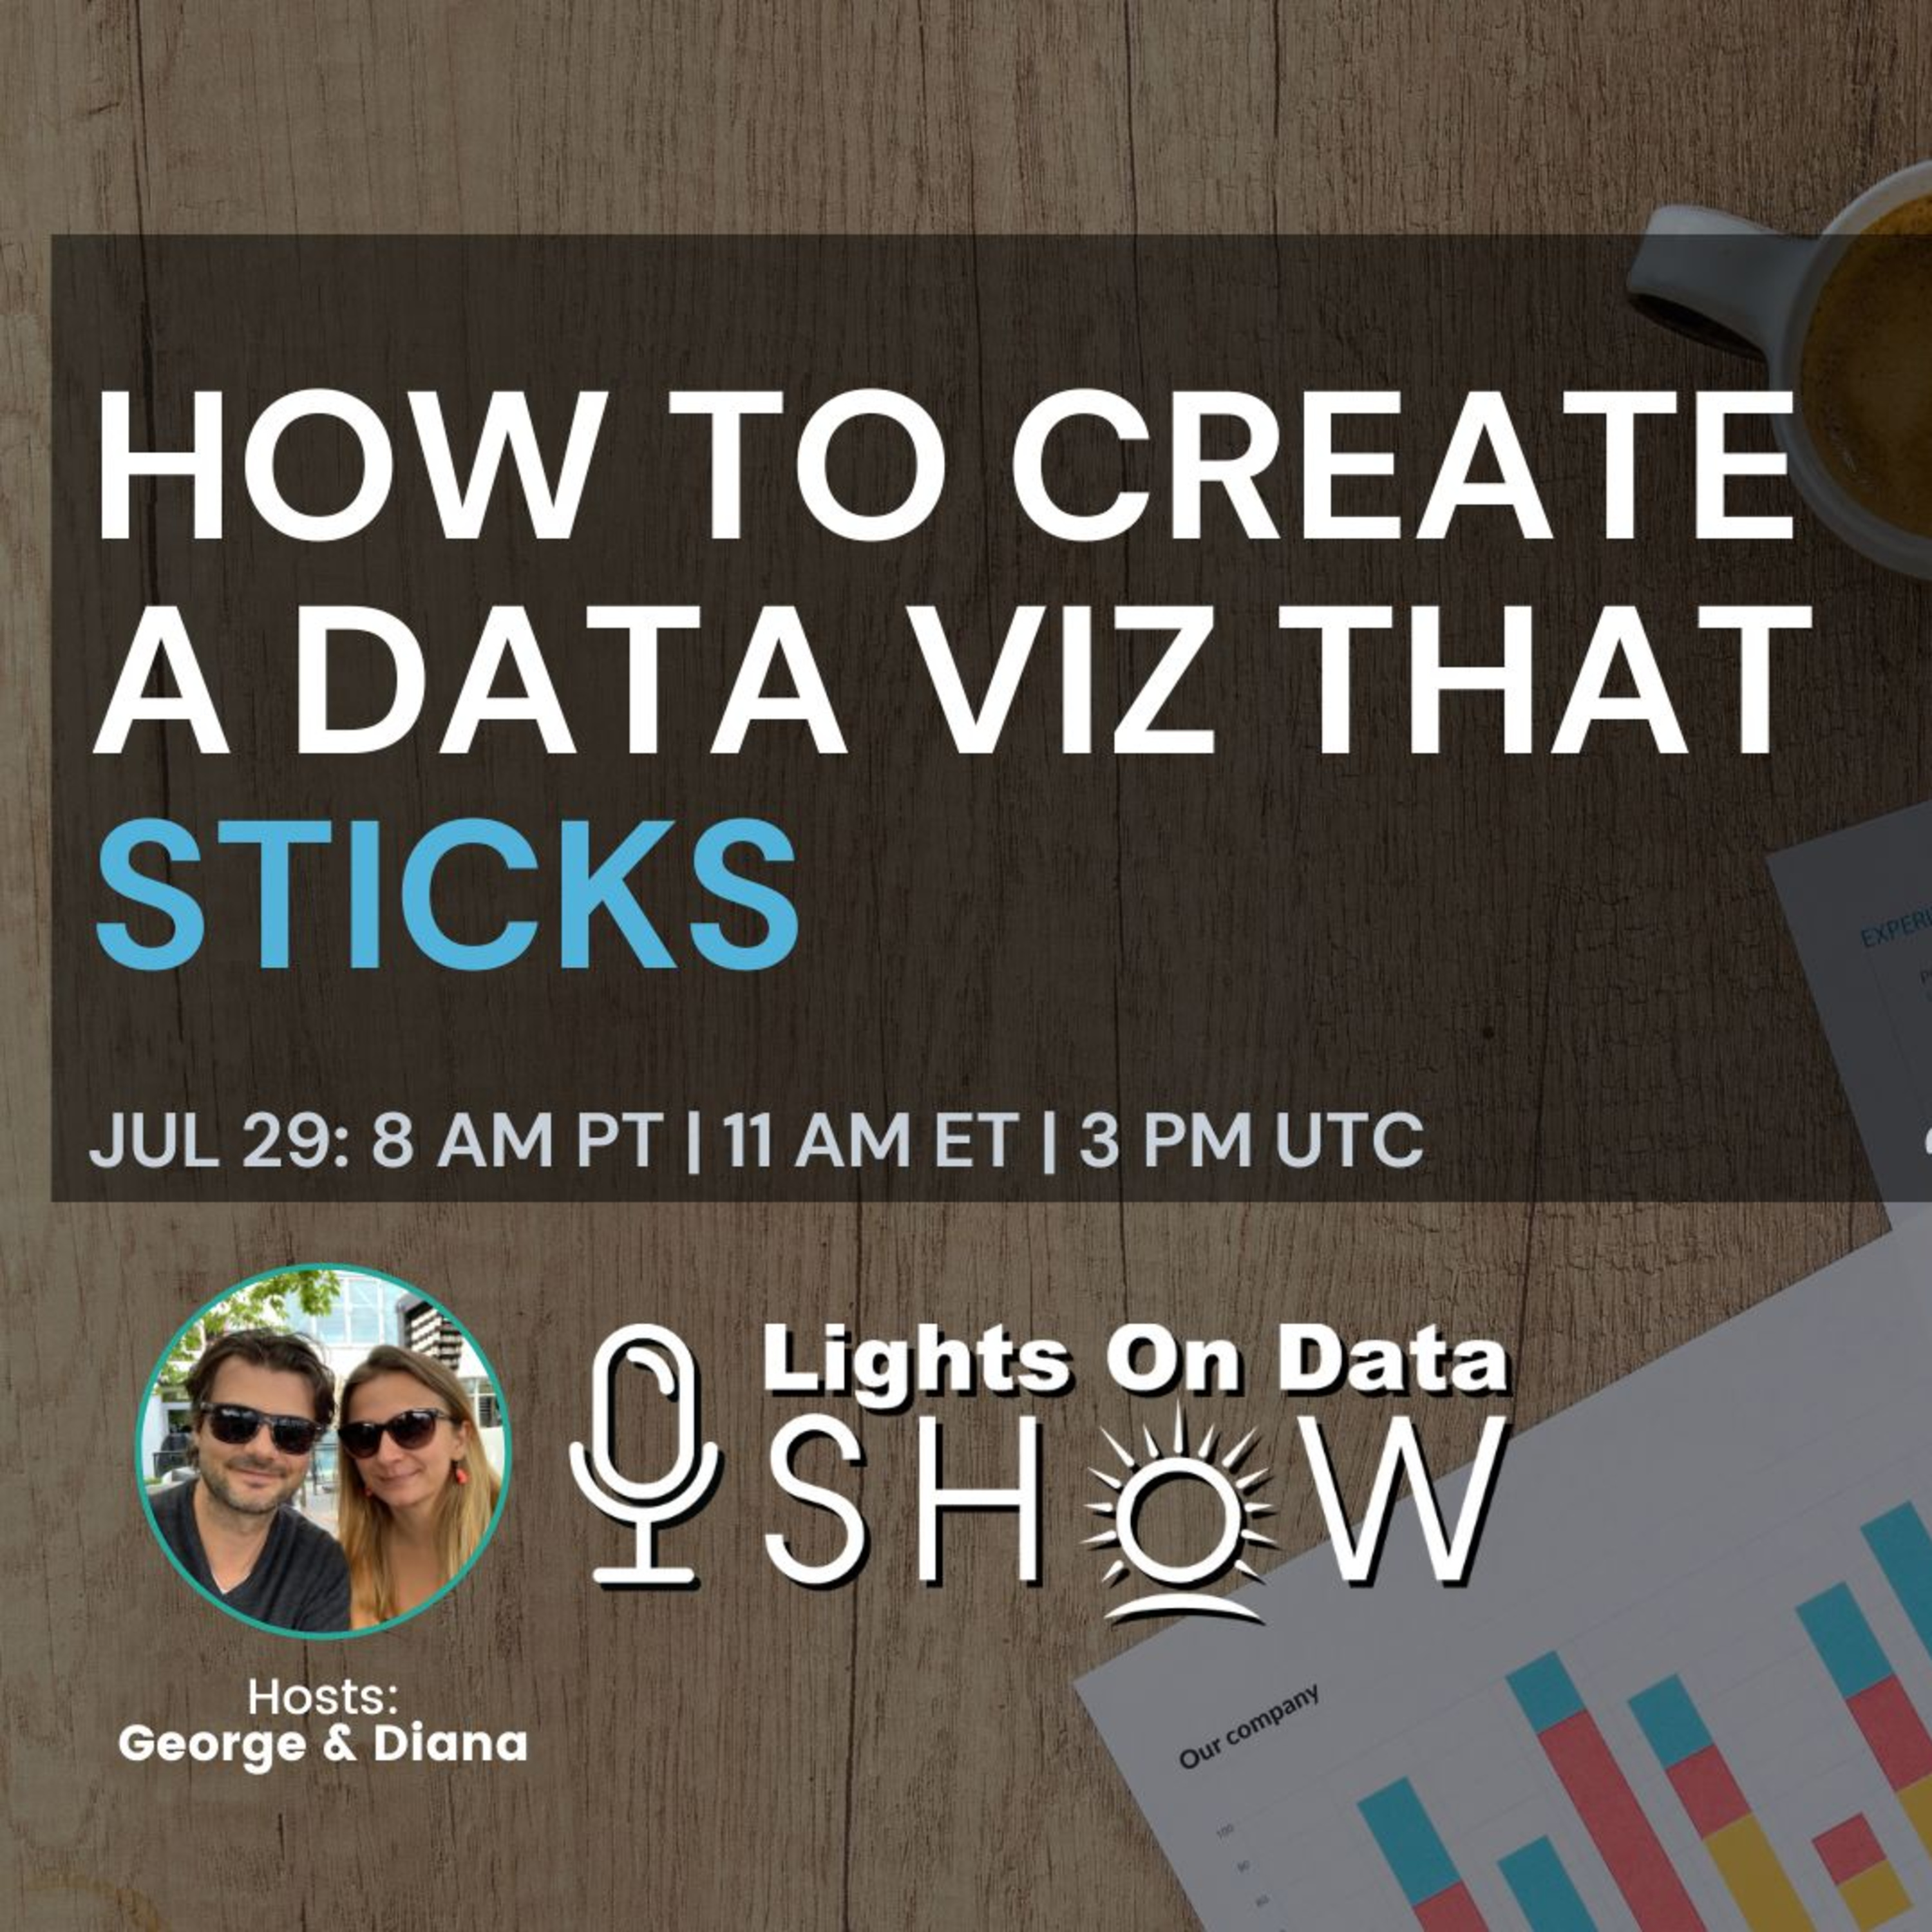
How to Create a Data Visualization That Sticks
from Lights On Data Show · host George Firican
Lee Feinberg is the Chief Data Officer and the creator of the concept, "Intent Before Content". He'll give us some tips on how to create a data visualization that sticks with the audience and the message it is trying to convey. Quick tips: its starts with the intent, knowing the audience, drawing the sketch, asking the question, and only at the end employing those data visualization best practices.
Embed this episode
Ready to play
How to Create a Data Visualization That Sticks
No transcript for this episode yet
Similar Episodes
No similar episodes found.
Similar Podcasts
No similar podcasts found.