
EPISODE · Sep 7, 2021 · 26 MIN
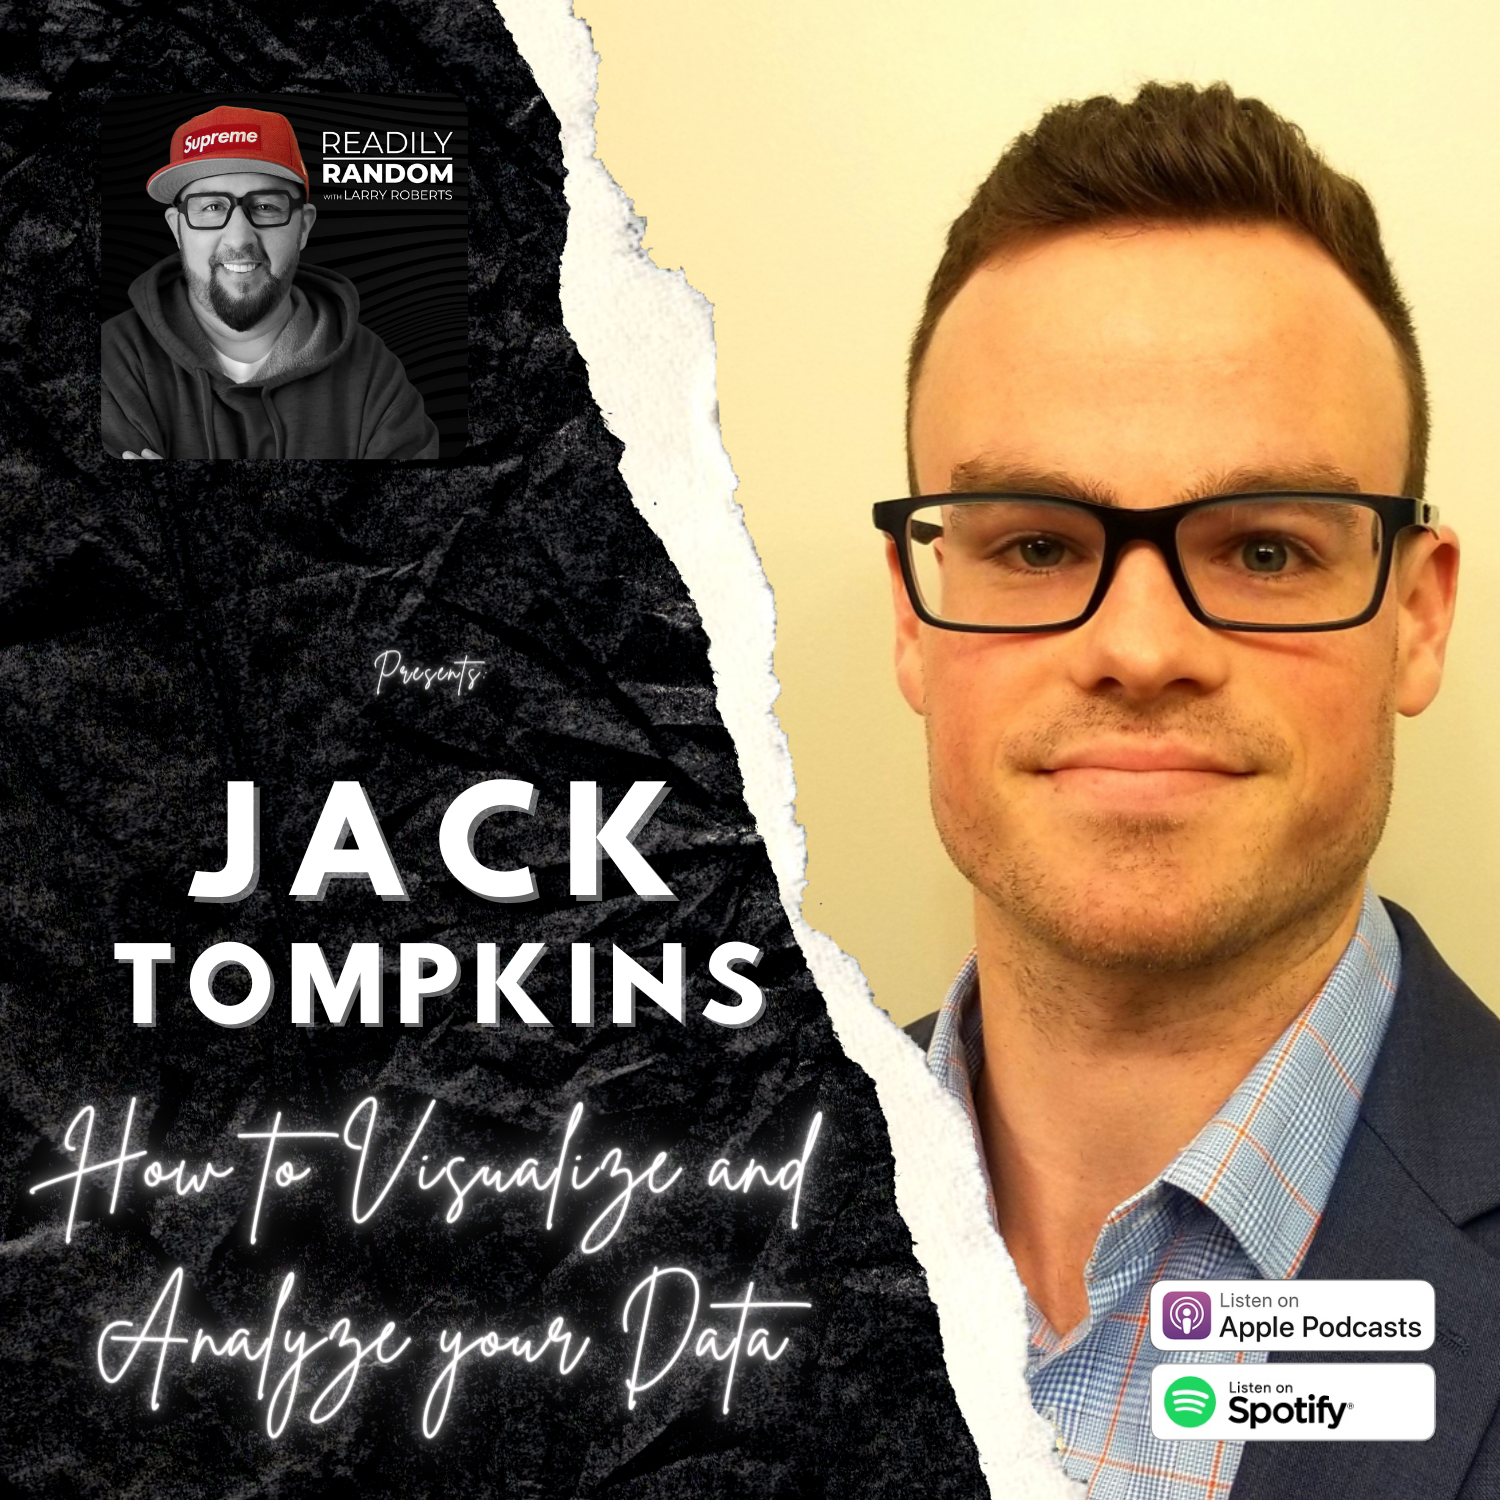
Jack Tompkins | How to Visualize and Analyze your Data
from You're the Boss
I get to take a walk down memory lane in this week's episode. We talk with a data analytics expert that helps explain the value of not only gathering our data consistently but also how to organize and visualize that data in a way that will allow us to make informed, intelligent day-to-day business decisions. Jack Tompkins is the owner of Pineapple Consulting Firm based out of Charlotte, NC. He helps you analyze and visualize your financial and marketing data in interactive charts, graphs, and dashboards so you don't have to deal with the annoying data gathering or manipulating of it! His goal is to help you grow profitably and efficiently by helping you not just know your numbers through and through, but also visualize them to quickly get the full picture.
Embed this episode
Ready to play
Jack Tompkins | How to Visualize and Analyze your Data
No transcript for this episode yet
Similar Episodes
No similar episodes found.