
EPISODE · Aug 5, 2024 · 5 MIN
Panic Monday! (What Now?)
from The Macro Compass
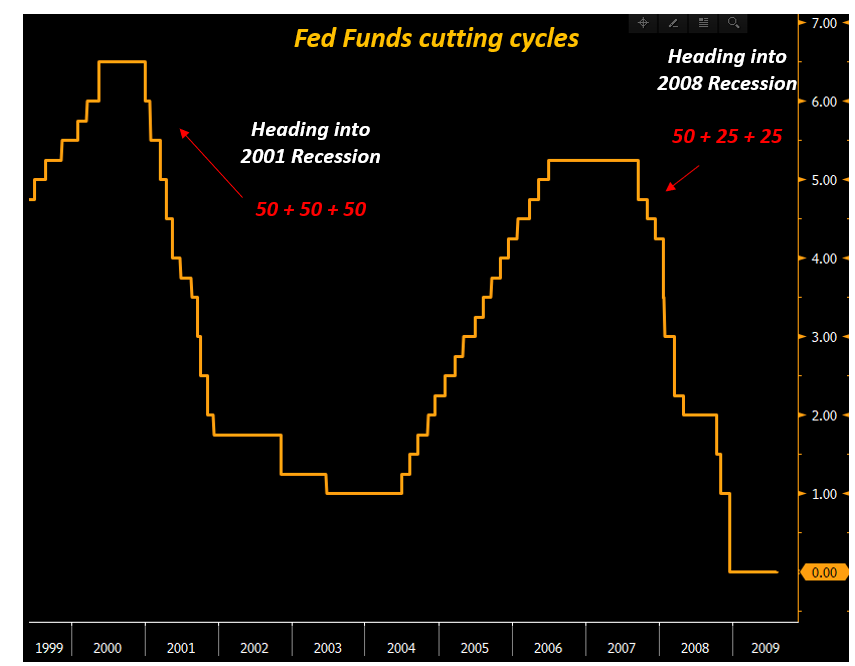
We just witnessed one of the biggest market panic events ever seen in the last 4 decades.At some point, Asian markets were down 10%+ in a single session and the Japanese bank index saw the largest daily loss since Black Monday in 1987.During such panic events, it’s important to remember three crucial rules:* Markets can remain irrational longer than we can stay solvent;* Opportunities abound, but it’s crucial to structure trade ideas and investments in a way that can allow us to sleep at night;* Keep following your process.But first: let’s understand the nature of this gigantic liquidation event.Is it happening because a recession is now inevitable?If this time isn’t different, the recession playbook is unfolding correctly:* The Central Bank raises rates aggressively;* Markets signal conditions are too tight: the yield curve inverts* The curve stays inverted for 12-27 months (!)* The economy slows* A late-cycle yield curve steepening (!) happens* Finally, a recession occursThe chart illustrates this sequence by setting the x-axis counter at 0 once the 2-10 year yield curve slope inverts, and marking in red the onset of a recession (private non-farm payrolls increasing by 25k or less on a 3-month moving average basis).Notice how the ’89-90s, 2001 and 2008 recessions all followed a prolonged inversion, and all occurred only once the curve had disinverted (green vertical dotted line).But the crucial point here is this.Markets are pricing us close to step 6.Yet data shows we are still at step 4-5.In other words: the move comes a bit from fundamentals, and a lot from panic.Private job creation in the US still averages ~150k/month today (left chart, blue) while in the months preceding the 2001 and 2008 recession we were creating only 0-50k jobs/month (right charts, red).And while it’s true that today the US population is bigger and the labor force is expanding rapidly, one can argue that macro data only justifies a portion of the panic move we saw recently.Just to give you a sense of the panic: the bond market is now pricing 5+ cuts over the next 3 meetings, and some odds of the Fed being forced to deliver intra-meeting emergency cuts.For reference, as we walked into the 2001 recession and the 2008 Great Financial Crisis, the Fed did this:Markets are now pricing 50 + 50 + 25: something of a middle ground between the 2001 recession and the late 2007 Fed cuts heading into the GFC.To visualize the panic reaction in bond markets, this is the chart that shows the market-implied probabilities that the Fed will cut by 50 bps 3 times in a row = full recession mode:Ok, so we have:* Asian indexes recording their worst 1-day loss since Black Monday in 1987;* The Nasdaq down 16% in 16 trading sessions (* Bond markets pricing a full-fledged recessionary Fed cutting cycle in the next 3 months.Yet macro data are not fully justifying this panic (yet).So what’s going on? Why is this happening?And also: here are 2 macro trade ideas to benefit from this market panic! This is a public episode. If you would like to discuss this with other subscribers or get access to bonus episodes, visit themacrocompass.substack.com
Embed this episode
Ready to play
Panic Monday! (What Now?)
No transcript for this episode yet
Similar Episodes
No similar episodes found.
Similar Podcasts
No similar podcasts found.