
EPISODE · Jun 10, 2026 · 11 MIN
The Hidden Nitrate Map Beneath Our Drinking Water
from Waterlines: How Water Shapes Our World · host jaywen
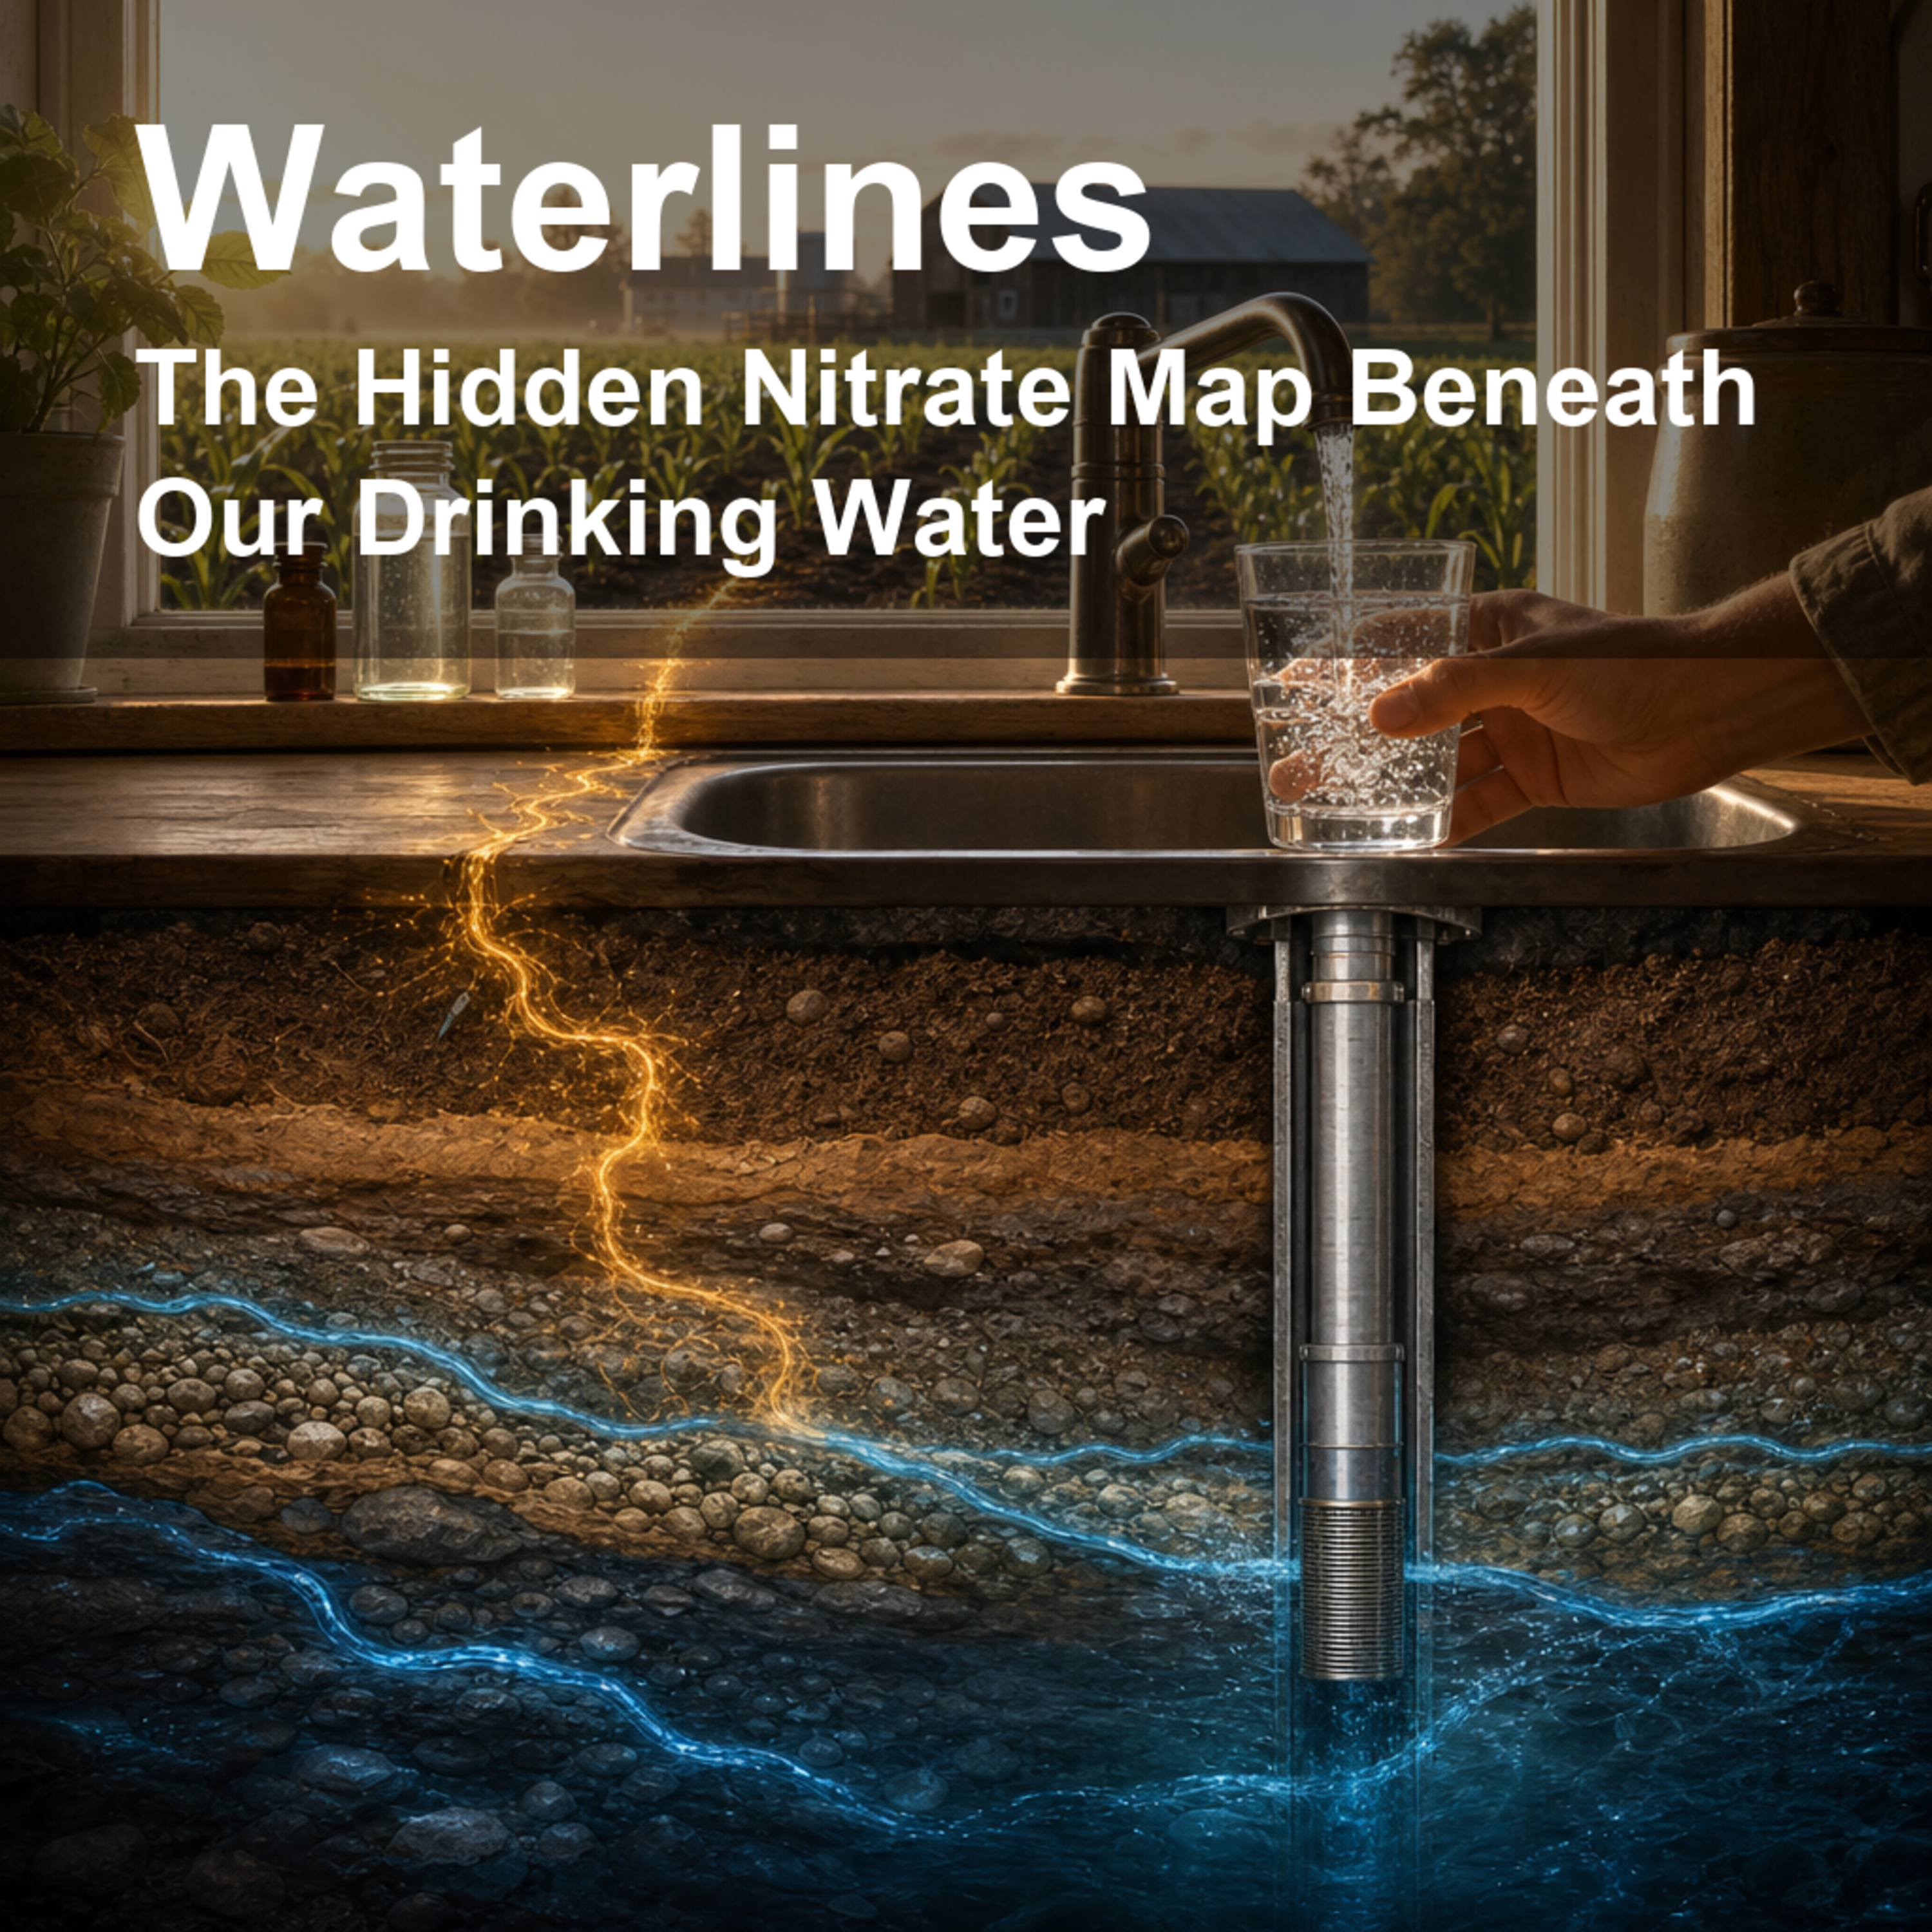
A glass of tap water can look perfectly clear and still carry a story from farm fields, soils, rainfall, rock layers, and decades of land use. This episode matters because groundwater supplies drinking water for millions of people, including many rural households with private wells, and nitrate is one of the most common contaminants that can make that water unsafe. We unpack how researchers used machine learning to make a national, three-dimensional map of nitrate risk in groundwater across the lower 48 states, and what that map can and cannot tell a family, water utility, or local decision-maker.Hosts A and B explain nitrate in plain language, why depth matters, why some aquifers are more vulnerable than others, and how a model called extreme gradient boosting can learn patterns from more than 12,000 wells without becoming a crystal ball. The conversation also explores SHAP, a tool the scientists used to ask the model which factors mattered most, from well depth and soil drainage to manure, fertilizer, precipitation, and land use. The big takeaway: high nitrate was predicted in only about 1 percent of the mapped groundwater-supply area, but roughly 1.4 million equivalent people rely on groundwater in those areas.Citation: Ransom, K.M., Nolan, B.T., Stackelberg, P.E., Belitz, K., and Fram, M.S. (2022). Machine learning predictions of nitrate in groundwater used for drinking supply in the conterminous United States. Science of the Total Environment, 807, 151065. https://doi.org/10.1016/j.scitotenv.2021.151065Disclosure: This Waterlines episode package is written for public-science communication and uses AI-generated voices for the host dialogue.
Embed this episode
NOW PLAYING
The Hidden Nitrate Map Beneath Our Drinking Water
No transcript for this episode yet
Similar Episodes
No similar episodes found.
Similar Podcasts
No similar podcasts found.