
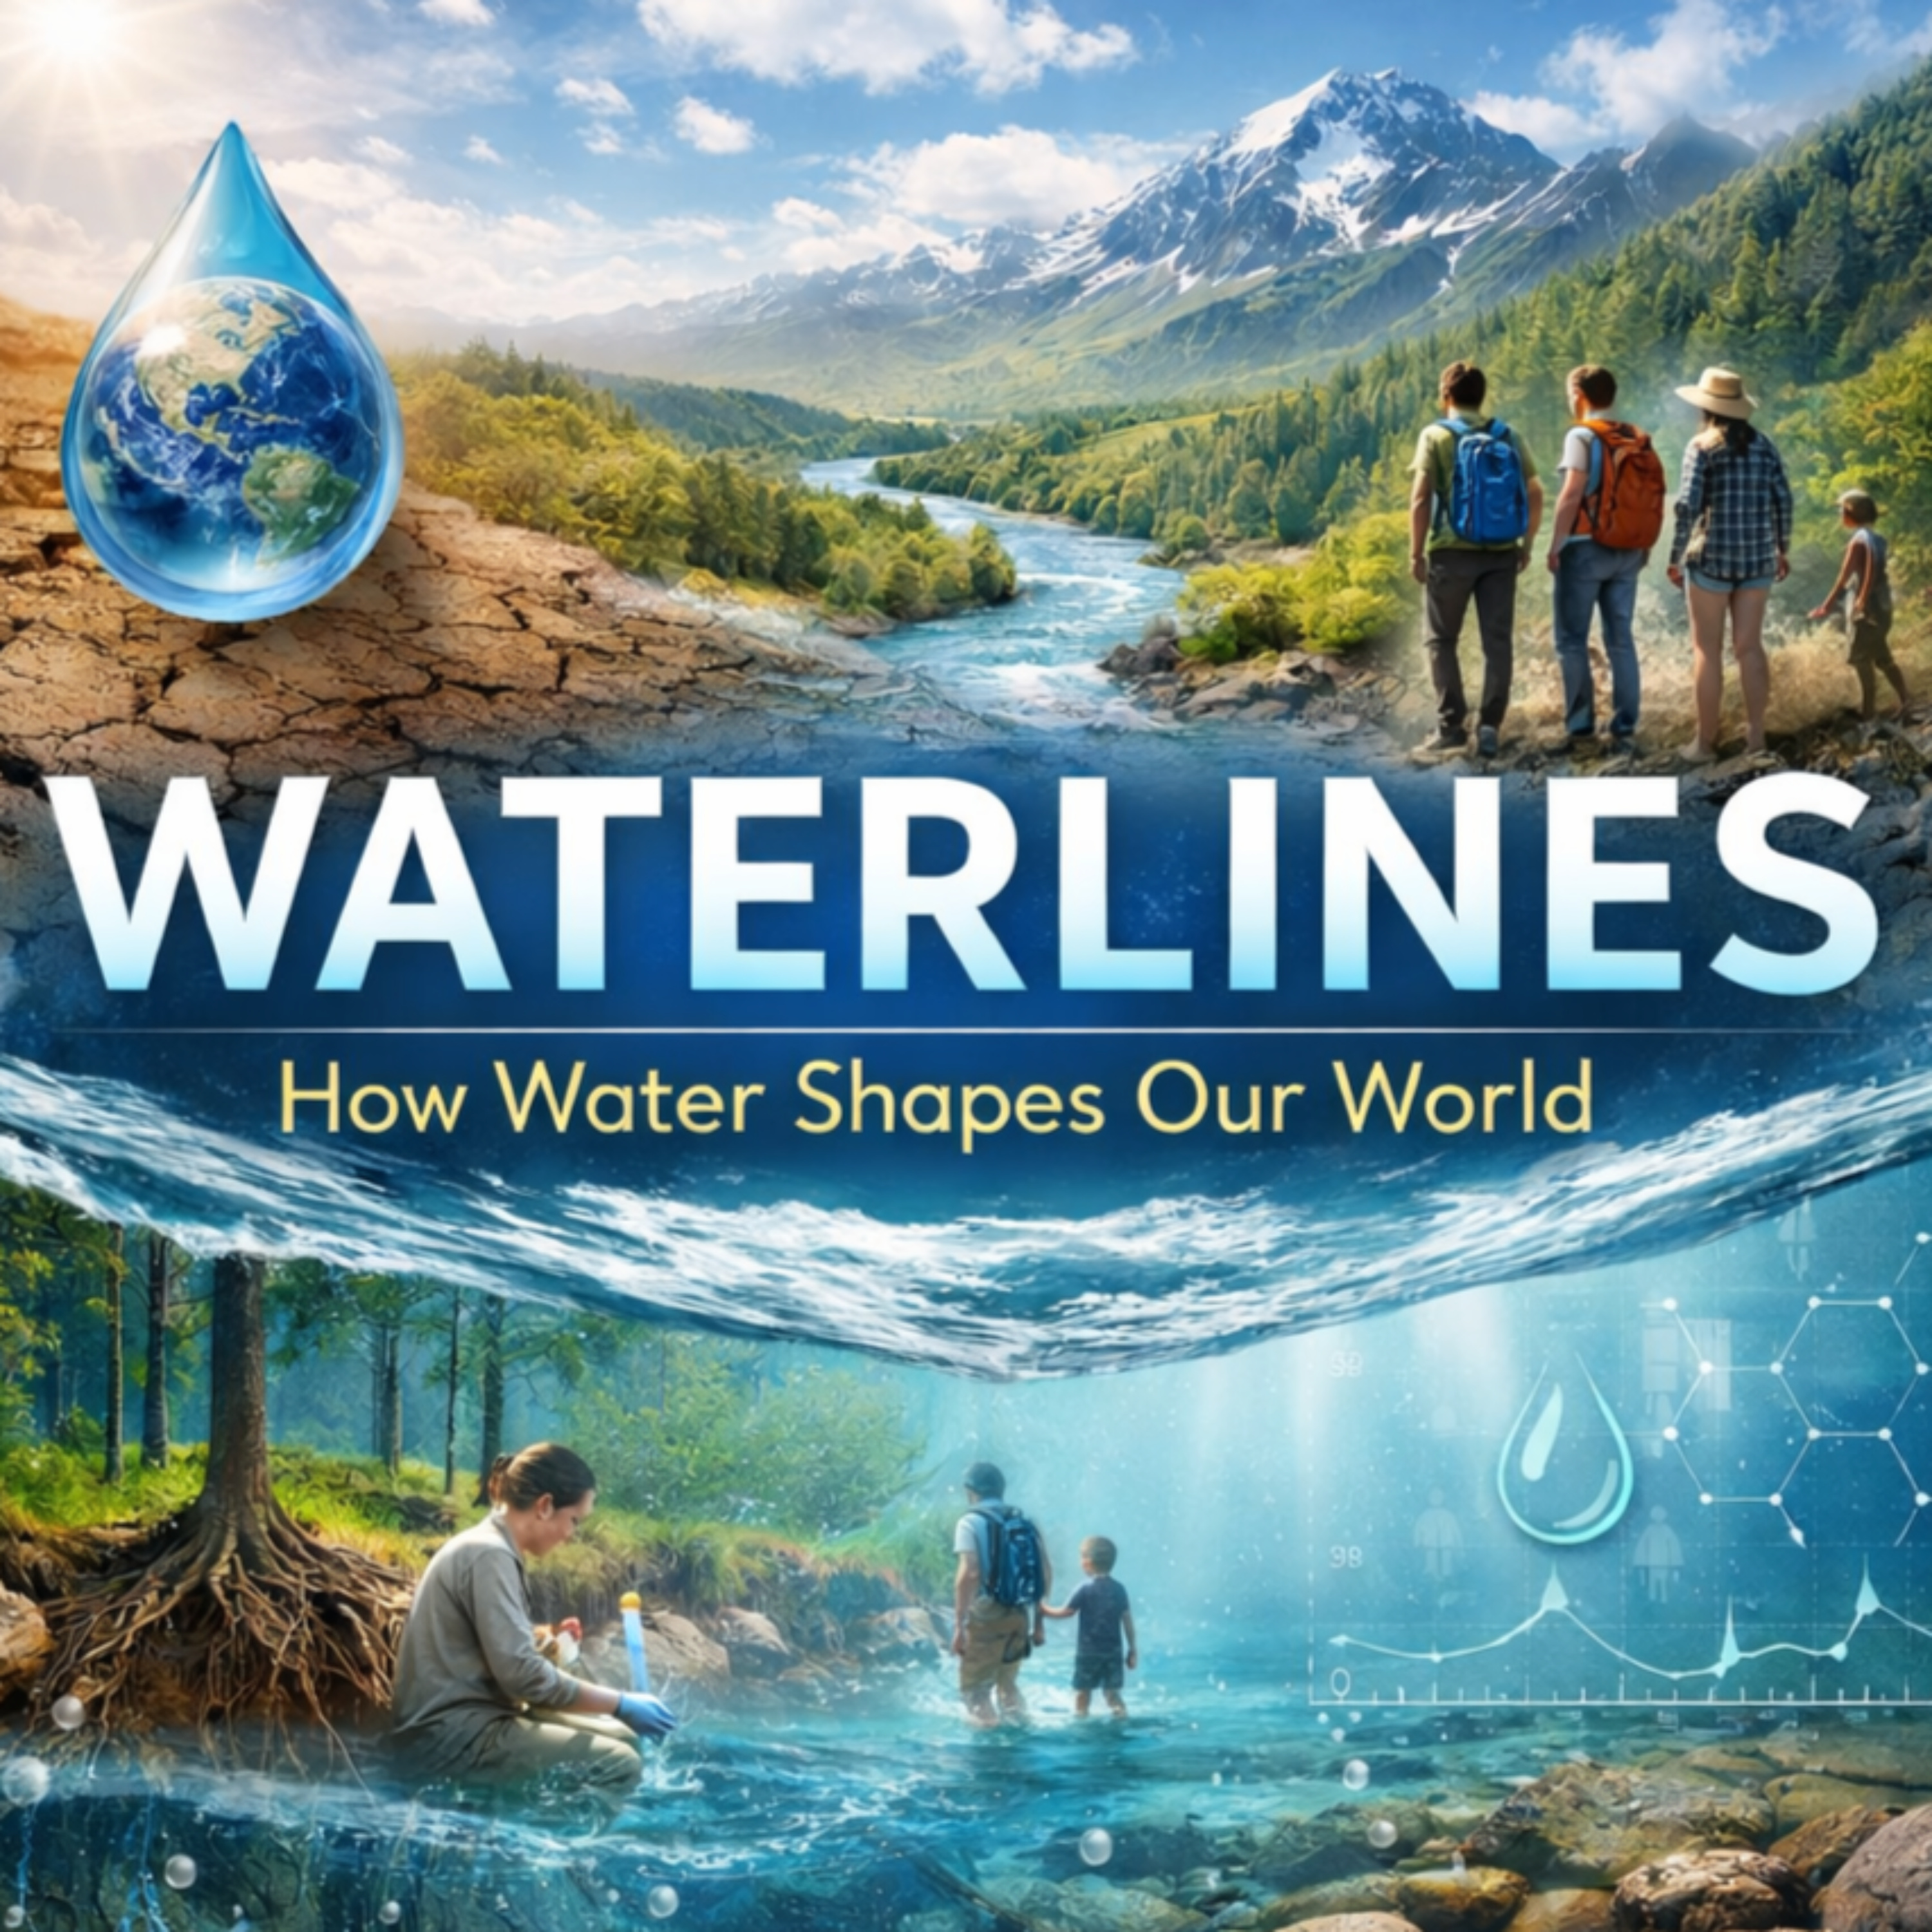
PODCAST · science
Waterlines: How Water Shapes Our World
by jaywen
✦ Waterlines: How Water Shapes Our World ✦ explores the hidden role of water in shaping our planet, ecosystems, and daily lives. Each episode turns advanced water science into engaging, everyday conversationsDesigned for curious listeners — no scientific background required — the show features researchers, field stories, and real-world challenges that reveal why water matters more than we think. Whether you’re interested in the environment, climate, or how science connects to society, Waterlines helps you see the world through the lens of water.
-
57
When Satellites Watch Rivers Rise and Fields Dry: Seeing Floods and Droughts Before They Become Disasters
Takeaway: Satellites do not replace people on the ground, but they can show the shape of missing or overflowing water when gauges are too few, too late, or too far apart.Floods can arrive overnight; droughts can creep in for months before anyone agrees what to call them. This episode matters because communities, farmers, emergency managers, insurers, and water planners all need the same thing: a clearer picture of where water is, where it is missing, and how fast conditions are changing. We explore how satellites help fill the gaps between river gauges, rain stations, soil probes, and field reports—especially in places where ground data are sparse or disasters unfold across huge regions.Using the edited scientific volume Remote Sensing of Hydrological Extremes as our guide, we unpack how different satellites “see” water: optical sensors that spot dark floodwater, microwave instruments that can work through clouds, radar that detects flooded forests, gravity missions that weigh changes in underground and surface water storage, and vegetation signals that reveal drought stress in crops and ecosystems. We visit examples from the Magdalena River in Colombia, snowmelt flooding in the Red River of the North, NASA global flood maps, Congo floodplain hydraulics, Southeast Asia flood impacts, and drought monitoring in Brazil, China, and the western United States.We also keep the science honest: satellite maps can miss water under trees, confuse cloud shadows with floods, struggle with coarse pixels, or need careful calibration with models and field data. But when used thoughtfully, they can turn scattered clues into practical warning and recovery information.Citation: Lakshmi, V. (ed.). Remote Sensing of Hydrological Extremes. Springer Remote Sensing/Photogrammetry. Springer International Publishing Switzerland, 2017. https://doi.org/10.1007/978-3-319-43744-6Disclosure: This Waterlines episode package is designed for production with AI-generated voices.
-
56
How Rain Can Check a Satellite’s Soil Moisture Map
Takeaway: A satellite soil-moisture map is more trustworthy when rainy days and wet ground line up in the pattern real soils naturally make.Flood warnings, drought outlooks, farm decisions, and climate models all depend on a deceptively simple question: how wet is the ground? Satellites can scan huge areas that no field crew could visit every day, but their soil-moisture maps are hard to check because a satellite pixel covers many kilometers while a ground sensor samples one small spot. This episode explores a clever workaround: instead of asking whether a satellite matches scattered soil probes, the researchers ask whether its wet-and-dry pattern makes sense when compared with large-scale rainfall.We unpack how soil moisture sits at the busy meeting place between rain, runoff, evaporation, plant water use, and heat. Then we follow the paper’s main idea: over time, real soils leave a recognizable fingerprint. Dry ground tends to be linked with lower recent rainfall, wet ground with higher rainfall, and the curve between them has a distinctive S-like shape because drainage, runoff, and evaporation respond differently as soils fill. If a satellite product scrambles that relationship, it may be carrying more error. The authors used a statistic called mutual information, explained here as a way to measure how much two messy datasets “know” about each other, to compare three AMSR-E satellite soil-moisture products across the contiguous United States from 2002 to 2011.The result is not one universal winner. The University of Montana product carried the most useful rainfall-linked information across about 50 percent of the region, the VUA-NASA product across about 47 percent, and the NASA product across about 3 percent. The better-performing product also depended on landscape: flatter, less vegetated areas tended to favor the University of Montana product, while more rugged or more vegetated areas often favored VUA-NASA. The study also found winter and frozen-ground behavior that needs care, reminding us that satellite data are powerful but not magic.Citation: Tuttle, S. E., & Salvucci, G. D. (2014). A new approach for validating satellite estimates of soil moisture using large-scale precipitation: Comparing AMSR-E products. Remote Sensing of Environment, 142, 207–222. https://doi.org/10.1016/j.rse.2013.12.002Disclosure: This Waterlines episode package is written for public-science listening and uses AI-generated voices.
-
55
How Satellites Catch Snow in the Act of Melting and Refreezing
Takeaway: A snowpack can look still, but its microwave glow changes when it flips between frozen storage and liquid water.Spring runoff, flood risk, irrigation water, forest timing, and even winter wildlife can all hinge on a quiet moment: when snow first starts turning to liquid water, then freezing again overnight. This episode follows a study that improves how satellites spot those freeze-thaw pulses from space. Instead of treating every day-night change in microwave signal as melt, the researchers ask a practical question: how much of that signal is just the snow and land getting warmer, and how much is actually water changing phase?We unpack how passive microwave satellites “see” snow, why wet snow suddenly looks brighter in microwave measurements, and why air temperature can help separate ordinary warming from real melt and refreeze. The conversation travels from a flat farm-country satellite pixel in the Northern Great Plains to Colorado’s Senator Beck Basin, where snow surface temperature and energy-balance instruments help test whether the satellite detections make physical sense. Along the way, we talk about why this matters for spring streamflow forecasts, snowpack models, climate records, and the everyday water supply that begins as mountain snow.Citation: Tuttle, S. E., & Jacobs, J. M. (2019). Enhanced identification of snow melt and refreeze events from passive microwave brightness temperature using air temperature. Water Resources Research, 55, 3248–3265. https://doi.org/10.1029/2018WR023995Disclosure: This Waterlines episode uses AI-generated voices for the hosts.
-
54
What pH Maps Reveal About Drinking Water in the Glacial Aquifer
Takeaway: In the glacial aquifer, water that rushes through thin, carbonate-poor sediment tends to stay acidic, while water that lingers through carbonate-rich layers often turns alkaline enough to loosen arsenic.A glass of well water can look perfectly clear and still carry clues about the ground it traveled through for years, decades, or longer. In this episode, we explore why groundwater pH is more than a number from chemistry class: it can shape whether arsenic stays stuck to aquifer sediments, whether manganese moves into water, and whether water is more likely to corrode plumbing. The study follows the huge glacial aquifer system across the northern United States, a water source for about 30 million people, and asks how machine learning can help map pH in a place too large and geologically tangled to model grain by grain.We unpack how researchers used pH measurements from 18,386 wells, information about soils and sediments, and estimates of groundwater age and flowpath length to predict where water is more acidic or more alkaline. Along the way, we talk about glaciers as messy aquifer builders, carbonate minerals as natural antacids, and why this kind of map is useful for planning monitoring—but not a substitute for testing an individual well.Citation: Stackelberg, P.E., Belitz, K., Brown, C.J., Erickson, M.L., Elliott, S.M., Kauffman, L.J., Ransom, K.M., and Reddy, J.E. (2021). Machine Learning Predictions of pH in the Glacial Aquifer System, Northern USA. Groundwater, 59(3), 352–368. https://doi.org/10.1111/gwat.13063Disclosure: This Waterlines episode uses AI-generated voices for the host conversation.
-
53
The Beach That Breathes With the Bay of Fundy’s Giant Tides
Takeaway: At this Bay of Fundy beach, the tide pushes seawater through the sand and gravel like a giant rinse cycle, sending it back to the coast in less than a day.Some coasts don’t just meet the ocean at the surface; they exchange water underground, tide after tide. This episode visits Advocate Beach in Nova Scotia, on the Bay of Fundy, where some of the world’s largest tides push seawater into a steep sand-and-gravel beach and pull it back out through the seabed. That hidden circulation can move nutrients and chemicals into coastal waters, shape shoreline ecosystems, and change how scientists think about beaches in a warming, changing coastal world.We unpack how researchers measured submarine groundwater discharge using seepage meters, radon and radium tracers, and water-level physics; why this mega-tidal beach showed very high discharge rates; and why most of the water was not fresh groundwater from land, but seawater rapidly recycled through the beach in less than a day.Citation: Craddock, R. D., Mohammed, A. A., Tamborski, J. J., & Kurylyk, B. L. (2024). Submarine Groundwater Discharge at a Mega-Tidal Beach. Hydrological Processes, 38, e15319. https://doi.org/10.1002/hyp.15319Disclosure: This Waterlines episode package is written from the cited paper and is designed for production with AI-generated voices.
-
52
When Arctic Permafrost Becomes Plumbing for the Coast
Takeaway: As Arctic permafrost thaws, the coast can gain hidden freshwater plumbing, but a rising sea can press back and slow that flow.Arctic coasts are not just losing ice at the surface; the ground beneath them is changing the routes water takes to the ocean. That matters because groundwater can carry carbon, nutrients, salt, metals, and other dissolved material into coastal ecosystems that people and wildlife depend on. In this episode, we unpack a modeling study that asks a surprisingly practical question: as the Arctic warms and seas rise, will more groundwater leak toward the coast, or less?The paper shows that the answer depends on a tug-of-war. Warming can thaw new pathways through permafrost, letting freshwater move toward the shore. Sea-level rise can push back by flattening the downhill pressure difference that drives groundwater seaward. In some scenarios, coastal groundwater discharge increases; in others, it drops. We translate that into everyday terms: frozen ground acting like a basement wall, thawed zones acting like hidden pipes, and the ocean acting like a rising water tank pressing against the land.Citation: Guimond, Julia A., Aaron A. Mohammed, Michelle A. Walvoord, Victor F. Bense, and Barret L. Kurylyk. “Sea-level rise and warming mediate coastal groundwater discharge in the Arctic.” Environmental Research Letters 17, no. 4 (2022): 045027. https://doi.org/10.1088/1748-9326/ac6085.Disclosure: This Waterlines episode package is written for public-science storytelling and uses AI-generated voices for the hosts.
-
51
When Frozen Ground Leaks: Snowmelt, Soil Cracks, and Prairie Water
Takeaway: Frozen soil is not a sealed lid; old roots and cracks can let snowmelt sneak down until that water refreezes and plugs the way.Winter runoff shapes spring floods, wetland refilling, groundwater supplies, and the movement of nutrients from fields into streams and aquifers. But frozen ground is not as simple as a hard lid on the landscape. This episode follows a modeling study from the Canadian Prairies that asks a deceptively everyday question: when snow melts on frozen soil, does the water run away, soak in, or recharge groundwater below? The answer depends on tiny shortcuts in soil—old root holes, worm channels, and cracks—that can let meltwater move quickly downward, until that same water refreezes and plugs the path for the next melt.We unpack how researchers built a hillslope model with two kinds of soil space: the ordinary fine pore network, and larger “macropores” that act like back roads for water. Their simulations show why one midwinter thaw may mostly infiltrate, while later melt events can produce more runoff after earlier water freezes inside the shortcuts. We also talk about why some groundwater recharge can begin before the whole ground thaws, what this means for prairie pothole wetlands and farm landscapes, and why warming winters may change both flood timing and recharge in ways that are not always obvious.Paper featured: Mohammed, A. A., Cey, E. E., Hayashi, M., & Callaghan, M. V. (2021). Simulating preferential flow and snowmelt partitioning in seasonally frozen hillslopes. Hydrological Processes, 35(8), e14277. https://doi.org/10.1002/hyp.14277This Waterlines episode uses AI-generated voices for the hosts, with human-directed scripting and review for clarity and scientific accuracy.
-
50
When Snowmelt Meets Frozen Ground: The Hidden Pores That Decide Flooding and Recharge
Takeaway: Frozen soil is not just a hard lid; if open pores stay clear, snowmelt can rush downward, but if those same pores ice up, the water is pushed across the surface.Spring melt can look simple from above: snow disappears, puddles form, streams rise. But just below our boots, frozen soil may either block meltwater like a lid or let it dive through hidden cracks and wormhole-like pores. This episode explores why that split matters for floods, groundwater recharge, farm nutrients, road salt, and water planning in cold regions as winters become more variable. We unpack a modeling study that gives frozen soil two “personalities”: the dense soil matrix and fast-flowing macropores. The researchers tested whether a physically based model could reproduce rapid infiltration and drainage through frozen structured soils, and how freezing inside those pathways can later plug them and turn meltwater into runoff. Along the way, we talk about what models can reveal, what they simplify, and why field observations are still essential. Citation: Mohammed, A. A., Cey, E. E., Hayashi, M., Callaghan, M. V., Park, Y.-J., Miller, K. L., & Frey, S. K. (2021). Dual-permeability modeling of preferential flow and snowmelt partitioning in frozen soils. Vadose Zone Journal, 20, e20101. https://doi.org/10.1002/vzj2.20101. This episode uses AI-generated voices.
-
49
How Prairie Puddles Refill Groundwater
Takeaway: In dry prairie country, the little ponds that appear after snowmelt can be the funnels that refill groundwater.Across dry farming regions, the water that keeps wells, wetlands, and streams going often begins in places we barely notice: shallow spring ponds in small dips in the land. This episode follows a Canadian Prairie study that asks a practical question for water managers: how can we estimate groundwater recharge when it happens through thousands of tiny, temporary ponds, especially when snow, frozen soil, and spring thaw make the plumbing complicated?We unpack how researchers built a lean computer model called VSMB-DUS to connect two everyday landscape pieces: an upland slope where snowmelt runs off, and a low depression where that water ponds, soaks in, and may become groundwater recharge. We visit the field setting near Calgary, where an artificial flooding experiment, soil moisture sensors, pond-level measurements, and groundwater wells helped test whether a simple water-balance approach could capture the big behavior without needing a supercomputer. The model was not perfect, especially for year-by-year snowmelt runoff, but it reproduced key pond, soil, and groundwater responses well enough to estimate recharge across many small depressions.Citation: Noorduijn, S.L., M. Hayashi, G.A. Mohammed, and A.A. Mohammed. 2018. A coupled soil water balance model for simulating depression-focused groundwater recharge. Vadose Zone Journal 17:170176. doi:10.2136/vzj2017.10.0176.Disclosure: This Waterlines episode package is written for public-science communication and uses AI-generated voices for the hosts.
-
48
When Frozen Ground Lets Water Through
Takeaway: Frozen ground is not always a sealed lid; when it freezes dry, open root holes and cracks can carry meltwater downward fast, while wet frozen soil usually holds it back until the ice thaws.Spring snowmelt can decide whether water soaks into the ground, rushes into streams, recharges groundwater, or carries sediment and pollutants across a landscape. But frozen soil is not simply a solid barrier. This episode follows a careful lab study that asked a surprisingly practical question for cold regions: when does frozen ground act like concrete, and when does it behave more like a hidden drainpipe?Hosts A and B unpack how researchers collected prairie soil columns from Alberta, froze them under wet and dry starting conditions, and compared intact soil full of natural root holes and cracks with repacked soil that lacked those larger pathways. The results show why the history of the soil before winter matters: dry, structured soil let ponded meltwater move through air-filled macropores incredibly fast, while wet frozen soil slowed infiltration to the pace of thawing ice. Along the way, we connect the findings to snowmelt flooding, groundwater recharge, farm fields, urban rain gardens, mine reclamation covers, and a warming climate with more midwinter thaws.Citation: Pittman F, Mohammed A, Cey E. Effects of antecedent moisture and macroporosity on infiltration and water flow in frozen soil. Hydrological Processes. 2020;34:795–809. https://doi.org/10.1002/hyp.13629Disclosure: This Waterlines episode uses AI-generated voices to present and discuss the research in an accessible public-science format.
-
47
Reading the Seafloor’s Hidden Plumbing With Temperature
Takeaway: Even far from shore, the seafloor can take seawater in upslope and return it downslope, and tiny temperature bends help reveal that hidden plumbing.The deep seafloor may seem like a sealed boundary, but water can move through it, carrying heat, salts, nutrients, and chemical signals between sediment and ocean. In this episode, we visit the Scotian Slope off Nova Scotia, where researchers asked whether tiny bends in seabed temperature profiles can reveal groundwater moving beneath thousands of meters of seawater. The story matters because these hidden flows may shape ocean chemistry and benthic ecosystems, and because scientists often have to infer them from difficult, expensive measurements collected in rough offshore settings.We unpack how heat works as a tracer, why a curved temperature profile does not automatically mean water is flowing, and how bottom-water temperature changes or sediment layers can fool a simple interpretation. The paper rethinks older methods, tests newer heat-tracing tools from land-based groundwater studies, and offers practical guidance for future ocean surveys. Its cautious finding: on the Scotian Slope, the patterns suggest seawater may recharge into the upper slope and discharge farther downslope, possibly influenced by buried salt structures.Citation: Kurylyk, B. L., Irvine, D. J., Mohammed, A. A., Bense, V. F., Briggs, M. A., Loder, J. W., & Geshelin, Y. (2018). Rethinking the use of seabed sediment temperature profiles to trace submarine groundwater flow. Water Resources Research, 54, 4595–4614. https://doi.org/10.1029/2017WR022353Disclosure: This Waterlines episode uses AI-generated voices for the host conversation.
-
46
When Frozen Ground Still Lets Water Move: Why Tiny Soil Curves Matter in a Warming North
Takeaway: Frozen soil is not a shut door for water; the thin liquid films left between ice and grains can change when streams flow and when the ground gives way.Frozen ground is not simply nature’s concrete. Even below freezing, thin films of liquid water can cling to soil grains, and those hidden films help decide when streams get winter flow, when roads buckle, and how thawing permafrost changes landscapes. In this episode, we unpack a modelling study that asks a deceptively practical question: if a computer model uses the wrong recipe for how soil freezes, how wrong can its water predictions become? The answer matters for flood forecasting, northern infrastructure, contaminant storage, and understanding climate change in cold regions.We follow a simple virtual hillslope draining to a small stream under permafrost and seasonal frost, in both sand and clay. The researchers tested several soil freezing characteristic curves, which are basically maps between temperature and how much water remains liquid in frozen soil. Their results show that this choice can shift thaw timing, change stream discharge, alter frost depth, and even change the apparent energy state of the ground. The conversation keeps the math in the background and focuses on what the science means for real places: roads over permafrost, winter baseflow, thawing active layers, and the hard work of measuring frozen soils well.Citation: Woo, A., McKenzie, J., Mohammed, A., Lamontagne-Hallé, P., & Devoie, É. (2026). Soil freezing characteristic curves in cryohydrogeological modelling. Advances in Water Resources, 214, 105355. https://doi.org/10.1016/j.advwatres.2026.105355Disclosure: This Waterlines episode uses AI-generated voices for the host conversation.
-
45
When Thawing Permafrost Becomes a Downhill Water Story
Takeaway: When permafrost thaws, the wetness and timing of the soil can decide whether old carbon sits long enough to become CO2 or is carried downhill in groundwater.Permafrost carbon is often described as a climate time bomb, but this episode looks at a quieter question with big consequences: once frozen ground thaws, where does that carbon actually go? On a high-Arctic hillslope in Svalbard, the answer depends on water. Does newly thawed carbon sit in damp soil long enough for microbes to turn it into carbon dioxide, or does groundwater carry it sideways toward streams, lakes, and the ocean? We unpack a modeling study that follows carbon-like tracers through the seasonally thawed “active layer,” showing how snowmelt, soil wetness, freeze-up, and sudden warm summers can change the path of old carbon. Along the way, we talk about why surface carbon and buried carbon move differently, why saturated ground can both speed transport and slow CO2 production, and why climate models still struggle to capture these hidden water routes.Citation: Hamm, A., Schytt Mannerfelt, E., Mohammed, A. A., Painter, S. L., Coon, E. T., and Frampton, A. (2025). Model-based analysis of solute transport and potential carbon mineralization in the active layer of a hillslope underlain by permafrost with seasonal variability and climate change. The Cryosphere, 19, 3693–3724. https://doi.org/10.5194/tc-19-3693-2025Disclosure: This Waterlines episode package is written for production with AI-generated host voices.
-
44
Cold Springs in a Warming Lagoon
Takeaway: Some of the coldest water in a summer lagoon can come from underground springs, but even those hidden cool spots are slowly warming from the top down.When coastal water gets too warm, the difference between stress and survival can come from places we barely see: cold groundwater seeping out of the shore. This episode visits Basin Head lagoon on Prince Edward Island, a shallow Marine Protected Area where a unique form of Irish moss has collapsed and summer water can get hot enough to matter for the whole food web. We unpack how researchers used drone thermal images, field sensors, stream measurements, radon tracing, and heat modeling to find hidden intertidal springs, estimate how much cool water they deliver, and ask whether those cool spots can last in a warming climate.The study shows a useful tension for coastal management: groundwater springs may not cool the entire lagoon much compared with sunlight and weather, but right where they emerge they create sharp cold-water plumes that could function as small thermal refuges. The catch is that groundwater is not frozen in time. Shallow aquifers can warm over decades, and springs fed from shallower depths may lose some of their cooling power sooner than deeper ones.Paper discussed: KarisAllen, J. J., Mohammed, A. A., Tamborski, J. J., Jamieson, R. C., Danielescu, S., and Kurylyk, B. L.: Present and future thermal regimes of intertidal groundwater springs in a threatened coastal ecosystem, Hydrol. Earth Syst. Sci., 26, 4721–4740, 2022, https://doi.org/10.5194/hess-26-4721-2022.Disclosure: This Waterlines episode uses AI-generated voices for the host conversation.
-
43
When Thaw Ponds Start Talking to Groundwater
Takeaway: A thaw pond may look like a puddle, but its climate role depends on whether water is quietly leaking into it, out of it, or both.Tiny Arctic ponds can look like quiet puddles, but they may be part of a much larger climate story. As permafrost thaws, water gathers in sunken ground and forms thermokarst ponds that can release carbon dioxide and methane. This episode follows researchers in Nunavik, northern Québec, as they ask a practical question with big implications: are these ponds sealed off by frozen ground, or are they exchanging water with the subsurface below them?We unpack how field teams measured pond water levels, rainfall, evaporation, seepage, groundwater wells, water chemistry, and the natural “fingerprints” of hydrogen and oxygen isotopes. The result is a more complicated, more useful picture: some ponds sitting in silty ground appear to leak water downward, while ponds in sand can rise and fall with groundwater. Those hidden connections matter because water can move carbon into, out of, and through these ponds, changing how scientists estimate greenhouse gas emissions from thawing northern landscapes.Full paper citation: Somera, R., Lemieux, J.-M., Birks, S.J., Fortier, P., Bélanger, A., & Mohammed, A.A. (2025). Quantifying groundwater exchanges in the water balance of small thermokarst ponds: implications for carbon cycling. Journal of Hydrology, 662, 133964. https://doi.org/10.1016/j.jhydrol.2025.133964Disclosure: This Waterlines episode uses AI-generated voices. The script is based on the cited research paper and is written for public science listening, not as a substitute for the paper itself.
-
42
When the Shoreline Moves Toward the Well: Saltwater, Erosion, and Island Drinking Water
Takeaway: On a small island, a well can turn salty not just when the sea rises, but when the shore shrinks and the rain stops refilling the ground.Small islands often depend on a thin, hidden store of freshwater underfoot. As climate change reshapes coasts, that underground water can be squeezed by the sea, by storms, by drier weather, and by erosion that physically moves the shoreline closer to wells. This episode visits Lennox Island in Atlantic Canada, where researchers worked with the Lennox Island Mi'kmaq First Nation to ask a practical question: which climate pressures most threaten the island aquifer that supplies drinking water?We unpack how freshwater and saltwater share space underground, why a confining layer can protect an aquifer from storm flooding, and why coastal erosion plus reduced recharge can be a powerful one-two punch. The study used field measurements, electrical resistivity surveys, and an integrated surface-subsurface computer model to test sea-level rise, storm surge, changing recharge, erosion, and combined impacts. The surprising result: storm surges had little effect on the deeper pumped aquifer in this setting, while reduced recharge and erosion pushed saltwater farthest inland, and together could move the saltwater wedge into the wellfield.Citation: Stanic, S., LeRoux, N. K., Paldor, A., Mohammed, A. A., Michael, H. A., & Kurylyk, B. L. (2024). Saltwater intrusion into a confined island aquifer driven by erosion, changing recharge, sea-level rise, and coastal flooding. Water Resources Research, 60, e2023WR036394. https://doi.org/10.1029/2023WR036394Disclosure: This Waterlines episode package is written for production with AI-generated host voices.
-
41
When Snowmelt Finds Hidden Pipes in Frozen Soil
Takeaway: Frozen ground is not always a lid; snowmelt can slip through root holes and cracks like hidden drainpipes, unless the water refreezes and plugs them.Spring melt can decide whether water soaks in, rushes into streams, recharges groundwater, or carries pollution downward. This episode follows a surprising idea from cold-region hydrology: frozen soil is not always a solid lid. Root holes, cracks, worm burrows, and other large pores can stay open after freezing, letting meltwater move quickly through ground that looks sealed from the surface. But those same pathways can also clog when the water refreezes, changing runoff, flood risk, groundwater recharge, soil moisture, and even heat movement in permafrost landscapes.We unpack a review and conceptual framework that brings together field observations, lab experiments, and modeling challenges around snowmelt infiltration in frozen soils. The conversation explains why older models that treat water as spreading evenly through tiny soil pores often miss what happens during real thaw events, and why scientists are now thinking in two connected worlds: the soil matrix, where water creeps through small pores, and macropores, where water can drop like it is using hidden drainpipes.Citation: Mohammed, A.A., B.L. Kurylyk, E.E. Cey, and M. Hayashi. 2018. Snowmelt infiltration and macropore flow in frozen soils: Overview, knowledge gaps, and a conceptual framework. Vadose Zone Journal 17:180084. doi:10.2136/vzj2018.04.0084Disclosure: This Waterlines episode package is written for production with AI-generated voices.
-
40
When Frozen Ground Starts Leaking: Permafrost, Groundwater, and the Hidden Paths of Thaw
Takeaway: In thawing permafrost, a small unfrozen tunnel can keep groundwater moving all winter and carry heat deeper into the ground.Across the North, frozen ground is not just a cold backdrop. It helps hold forests up, shapes wetlands, controls where water can move, and supports roads, buildings, and pipelines. This episode follows a modeling study from Scotty Creek in Canada’s Northwest Territories, where thawing permafrost plateaus are slowly changing into wetter landscapes. The science asks a deceptively practical question: if we want to predict thaw, how do we start a computer model in a world that has never really been steady?We unpack why permafrost thaw is not simply ice melting downward like an ice cube. Water pools in tiny low spots, peat gets wetter and conducts heat differently, and unfrozen pathways called taliks can keep groundwater moving through winter. The paper shows that a model with a realistic “warm-up” period and an unfrozen layer above the permafrost matched field conditions better than a simpler steady-state setup. That matters for understanding ecosystem change, winter streamflow, carbon-rich peatlands, and efforts to protect high-value northern infrastructure.Citation: Langford, Joelle E., Robert A. Schincariol, Ranjeet M. Nagare, William L. Quinton, and Aaron A. Mohammed. 2020. “Transient and Transition Factors in Modeling Permafrost Thaw and Groundwater Flow.” Groundwater 58, no. 2: 258–268. https://doi.org/10.1111/gwat.12903.Disclosure: This Waterlines episode package is written for public science communication and uses AI-generated voices for the host conversation.
-
39
When Frozen Ground Still Drinks: Snowmelt Shortcuts Beneath Prairie Grasslands
Takeaway: Even frozen ground can drink snowmelt through tiny soil shortcuts, sending water sideways into prairie hollows and down to groundwater before the soil has thawed.Cold-region water supplies often depend on a very brief, messy season: the days when snow turns to water but the ground is still frozen. This episode matters because that timing affects wells, wetlands, spring flooding, farm fields, and how pollutants may move from the surface into groundwater. We visit three grassland sites in the Canadian Prairies, where researchers watched snowmelt move over hills, collect in small depressions, and sometimes slip through frozen soil faster than expected. The surprising lesson is that frozen ground is not always a sealed lid; old root channels and other soil openings can act like hidden plumbing.Using field instruments, time-lapse cameras, snow surveys, soil moisture probes, thermometers, and groundwater wells, the study tracked how meltwater was split among infiltration, runoff, ponding, evaporation, and recharge. The hosts explain why midwinter warm spells can first let water enter the soil, then refreeze it, changing how much runoff happens during the next melt. They also unpack why small prairie hollows can become focused recharge points for groundwater before the soil fully thaws.Citation: Mohammed, A. A., Pavlovskii, I., Cey, E. E., and Hayashi, M.: Effects of preferential flow on snowmelt partitioning and groundwater recharge in frozen soils, Hydrology and Earth System Sciences, 23, 5017–5031, 2019, https://doi.org/10.5194/hess-23-5017-2019.Disclosure: This Waterlines episode package is designed for production with AI-generated voices.
-
38
The Hidden Taste Map of America’s Groundwater
Takeaway: Groundwater changes as it travels downward through rock, and across much of the United States the deeper water shifts from fresh, bicarbonate-rich water toward saltier, chloride-rich water.Groundwater is not just water stored underground; it carries a chemical story of the rocks, soils, climate, and time it has moved through. That story matters when communities drill wells, treat drinking water, estimate salinity, protect streams, or plan for deeper and sometimes saltier water supplies. In this episode, we explore how researchers used a machine-learning approach to make a three-dimensional map of major groundwater water types across the conterminous United States, from near the water table down below the usual depth of drinking-water supplies. The conversation keeps the chemistry plain: some groundwater is newly recharged and bicarbonate-rich, while deeper water often shifts toward chloride-rich, saltier conditions. We also talk about what the model can and cannot tell us locally, why depth relative to drinking-water wells turned out to be so important, and how maps like this can help people think more clearly about groundwater as a changing underground landscape.Citation: Stackelberg, P. E., Knierim, K. J., Belitz, K., Cravotta III, C. A., McCleskey, R. B., and Killian, C. D. 2026. Predicting Groundwater Hydrochemical Facies in Three Dimensions with Random Forest Classification, USA. Groundwater. https://doi.org/10.1111/gwat.70072Disclosure: This Waterlines episode uses AI-generated voices for the hosts.
-
37
When Permafrost Becomes a Leaky Filter: Wastewater, Groundwater, and a Warming North
Takeaway: In permafrost country, frozen ground can slow pollution like a seasonal gate, but warming and salty wastewater can make that gate leakier.Across the Arctic and subarctic, many small communities depend on wastewater lagoons and landfills built in landscapes where frozen ground has long acted like part of the plumbing. But as permafrost warms, that hidden plumbing can change. This episode follows a study that asks a practical question with big stakes: if wastewater seeps into cold ground, where can those dissolved chemicals go as the soil freezes, thaws, and sometimes opens new underground pathways? We unpack how scientists built a model that links groundwater flow, heat, ice, and chemistry, then tested scenarios around a municipal wastewater lagoon in the Canadian subarctic. The story is not simply “thaw equals disaster.” Frozen ground can slow transport, seasonal freezing can trap solutes, and some nutrients break down or stick to sediments before reaching a river. But warm permafrost, salty water, and taliks—unfrozen corridors through frozen ground—can make the subsurface more connected and harder to predict. Citation: Mohammed, A. A., Bense, V. F., Kurylyk, B. L., Jamieson, R. C., Johnston, L. H., & Jackson, A. J. (2021). Modeling reactive solute transport in permafrost-affected groundwater systems. Water Resources Research, 57, e2020WR028771. https://doi.org/10.1029/2020WR028771. Disclosure: This Waterlines episode package is written for public science communication and is intended for production with AI-generated voices.
-
36
When Groundwater Sneaks to the Sea: Lessons from a Nova Scotia Harbour
Takeaway: In this Nova Scotia harbour, most groundwater reached the sea by first feeding streams, not by quietly leaking straight through the harbour floor.Coastal water problems often look like they begin at the shoreline: a beach closes, shellfish harvests pause, or a harbour turns unexpectedly risky after rain. But the water carrying nutrients or bacteria may have started underground, moving through soil and rock long before anyone sees it. In this episode, we visit Mabou Harbour on Cape Breton Island, Nova Scotia, where researchers asked a practical question with big stakes for coastal communities: does groundwater reach the sea mostly by seeping directly through the harbour bottom, or by feeding streams that then empty into the harbour? The answer matters for monitoring pollution, protecting aquaculture, and understanding how glacial landscapes route freshwater to the coast. The study found that in this till-dominated watershed, direct submarine groundwater discharge was a small part of the full watershed budget: about 3.9% of groundwater discharge, compared with 96.1% delivered as stream baseflow. But the groundwater that does seep directly into the harbour tends to come from nearby land and travel along shorter paths, which can leave less time for natural filtering before it reaches coastal water. This episode uses AI-generated voices. Citation: Craddock, R.D., Kennedy, G.W., Jamieson, R.C., Keizer, J., Mohammed, A.A., & Kurylyk, B.L. (2022). Assessment of groundwater discharge pathways in a till-dominated coastal aquifer. Journal of Hydrology: Regional Studies, 44, 101205. https://doi.org/10.1016/j.ejrh.2022.101205
-
35
When Rising Seas Thaw Frozen Ground from Below
Takeaway: Rising seas can thaw Arctic permafrost from the side because salty groundwater stays liquid at temperatures where fresh groundwater would freeze.Arctic coasts are changing in ways people can see: cliffs crumble, waves reach farther inland, and roads and buildings sit on less certain ground. This episode looks at a harder-to-see change happening underground, where rising seas can push salty water into coastal permafrost and help thaw it from the side, not just from the warming air above. We unpack how salt lowers water’s freezing point, why that matters for frozen soil, and what this could mean for Arctic communities, coastal infrastructure, groundwater, and carbon stored in once-frozen ground.The paper follows a modeling study, not a single field site, so we talk about both its power and its limits: it brings together groundwater flow, heat, salt movement, freezing and thawing, and salt left behind as ice forms. The result is a clearer picture of a hidden coastal feedback: sea-level rise does not only flood the surface; it can change the freezing rules underground.Citation: Guimond, J. A., Mohammed, A. A., Walvoord, M. A., Bense, V. F., & Kurylyk, B. L. (2021). Saltwater intrusion intensifies coastal permafrost thaw. Geophysical Research Letters, 48, e2021GL094776. https://doi.org/10.1029/2021GL094776Disclosure: This Waterlines episode package is written for production with AI-generated voices.
-
34
As Ice Sheets Lighten, Seawater Moves Underground
Takeaway: When an ice sheet loses weight, the hidden pressure drop underground can let seawater creep inland into aquifers that used to be fresh.Coastal water problems are often pictured at the surface: rising tides, eroding shorelines, flooded roads. This episode goes below the beach and under the ice, where the weight of Greenland- or Antarctica-scale ice sheets can help decide whether underground water stays fresh or turns salty. We explore a new modeling study showing that as an ice sheet thins and retreats, the pressure it once placed on the ground relaxes. That pressure change can shift the hidden boundary between freshwater and seawater, allowing saltwater to move inland through coastal aquifers. Hosts unpack why this matters for drinking-water quality, coastal ecosystems, ocean chemistry, and how we interpret ancient glacial landscapes still carrying the fingerprints of past ice. The study is not a site-specific prediction; it uses idealized numerical models to reveal a mechanism that field observations have hinted at but had not clearly explained. Citation: Guimond, J. A., Mohammed, A. A., Kurylyk, B. L., Walvoord, M. A., & Bense, V. F. (2026). Ice sheet dynamics drive pronounced changes in the subsurface freshwater‐saltwater interface. Geophysical Research Letters, 53, e2025GL120376. https://doi.org/10.1029/2025GL120376. Disclosure: this Waterlines episode package is written for public-science audio and uses AI-generated voices.
-
33
When Thawing Permafrost Reroutes a Gasoline Spill Underground
Takeaway: When permafrost thaws, it can turn frozen ground from a barrier into a new route that steers pollution through groundwater.Across the North, warming ground is changing more than landscapes and roads; it is changing the hidden plumbing that can carry drinking-water contaminants. This episode follows a new modelling study that asks a practical question: if gasoline leaks into shallow groundwater where permafrost is thawing, where might the pollution go, and what helps it break down?Hosts unpack how frozen ground can act like a subsurface traffic barrier, pushing groundwater and dissolved chemicals around it, and how thaw can open new routes through previously blocked layers. The paper introduces SMOKER-BIO, a numerical model that links groundwater flow, heat, freeze-thaw, and the biological breakdown of gasoline compounds such as benzene, toluene, ethylbenzene, and xylene. In the study’s conceptual test case, the changing flow paths caused by permafrost had a stronger effect on plume shape and movement than the colder temperatures did on biodegradation rates, partly because oxygen was already limited.We also talk about what the model does not yet prove: this is a simplified virtual spill, not a field validation, and the authors note the need for more cold-region reaction data, seasonal surface temperatures, multiple electron acceptors, and comparison with real spill sites.Citation: Molson, John, Aaron Mohammed, and Mario Schirmer. 2024. “Numerical modelling of multi-component mass transport in a permafrost-impacted groundwater flow system.” Proceedings of the 12th International Conference on Permafrost (ICOP2024), Whitehorse, Yukon, pp. 290–296. https://doi.org/10.52381/ICOP2024.126.1Disclosure: This Waterlines episode package is written for production with AI-generated host voices.
-
32
When Hot Pipelines Warm Frozen Ground
Takeaway: A hot buried pipeline with damaged insulation can quietly turn frozen ground into a warm wet chimney, and careful temperature modeling helps find the trouble before it spreads.Cold ground is not just scenery around northern infrastructure; it is part of how roads, wetlands, streams, soils, and communities stay stable through winter. This episode follows a real pipeline corridor in northern Alberta where buried pipes carrying very hot water could heat nearby soil if their insulation failed. The story is about more than pipelines: it shows how snow, frost, groundwater, and heat move together underground, and how scientists turn scattered field temperatures into a practical warning system.We unpack how researchers combined weather records, freeze-thaw physics, and a field survey along 12 kilometers of buried pipe to distinguish normal winter ground from ground warmed by damaged insulation. Along the way, we explain why snow can act like a blanket, why water freezing and thawing slows temperature change, and why modeling the air-ground boundary is harder than it sounds.Citation: Nagare, R. M., Mohammed, A. A., Park, Y.-J., & Schincariol, R. A. (2021). Modeling shallow ground temperatures around hot buried pipelines in cold regions. Cold Regions Science and Technology, 187, 103295. https://doi.org/10.1016/j.coldregions.2021.103295Disclosure: This Waterlines episode package is written for production with AI-generated voices.
-
31
When Permafrost Thaws, Groundwater Can Carry Old Carbon Back Into the World
Takeaway: When permafrost thaws, old carbon can ride newly opened groundwater paths toward streams before the frozen ground is gone.Frozen ground is not just cold dirt; in Arctic landscapes, it can be a deep storage vault for ancient carbon and a plug that limits underground water movement. This episode follows a modeling study that asks what happens when that plug thaws and groundwater starts moving again. The answer matters for rivers, lakes, coastal waters, and climate: some carbon may be turned into greenhouse gases underground, while some may travel with groundwater into streams long before all the permafrost disappears. Hosts unpack the idea of a virtual experiment, why old carbon buried several meters down is hard to measure, and what field data scientists still need to make better forecasts for a warming Arctic. This episode uses AI-generated voices. Citation: Mohammed, A. A., Guimond, J. A., Bense, V. F., Jamieson, R. C., McKenzie, J. M., & Kurylyk, B. L. (2022). Mobilization of subsurface carbon pools driven by permafrost thaw and reactivation of groundwater flow: a virtual experiment. Environmental Research Letters, 17, 124036. https://doi.org/10.1088/1748-9326/aca701
-
30
Reading Arctic Thaw in Stream Water
Takeaway: A thawing Arctic stream can carry a chemical fingerprint of how deep summer meltwater has reached, but the fingerprint changes from valley to valley.Arctic permafrost is not just frozen ground far away; it helps decide where water can flow, what streams carry, and how climate change reshapes northern landscapes that affect ecosystems and people downstream. This episode follows researchers in northern Alaska who asked whether streams can act like landscape-scale thermometers—not by measuring temperature, but by carrying chemical clues from the ground they drain.We visit three permafrost catchments near Toolik Field Station: tundra, lake-influenced tundra, and a steeper alpine valley. As the summer thaw deepens, water can move through deeper soil layers and pick up different elements, such as calcium, magnesium, sodium, sulfur, and strontium. The team tested whether those stream chemicals could reveal seasonal ground thaw across whole catchments, where simple probing is hard and remote sensing can miss local detail.The headline is both promising and humbling: stream chemistry can help trace thaw, but there is no universal chemical “magic marker.” Different landscapes gave different useful tracers, shaped by geology, soils, lakes, slope, and flow paths. That makes this a story about climate change, but also about listening carefully to place.Citation: Grose, Amelia L., Jay P. Zarnetske, Arsh Grewal, Arial J. Shogren, Abigail F. Rec, Jonathan A. O'Donnell, Benjamin W. Abbott, and William B. Bowden. “Tracing Seasonal Ground Thaw with Stream Chemistry in Alaskan Arctic Permafrost Catchments.” Hydrological Processes 40 (2026): e70512. https://doi.org/10.1002/hyp.70512.Disclosure: This Waterlines episode uses AI-generated voices to present and discuss the research.
-
29
Fluoride in Well Water: When Groundwater Has Too Little—or Too Much
Takeaway: Groundwater can carry either too little or too much fluoride, and the only way to know your well’s story is to test the water.Millions of people in the United States turn on the tap and drink water that came straight from the ground, especially from private domestic wells. Unlike many city water systems, those wells are usually not routinely monitored, treated, or adjusted for fluoride. This episode follows a national USGS study that asks a deceptively everyday question: what does natural groundwater actually contain before anyone treats it?We unpack why fluoride is both helpful and risky depending on dose: low levels can protect teeth, while high levels can create health concerns. The surprise is that, at the national scale, most domestic well samples were below the U.S. Public Health Service’s oral-health benchmark of 0.7 mg/L, while a much smaller share exceeded EPA’s 2 mg/L secondary standard or 4 mg/L drinking-water limit. But the map is uneven. Some western aquifers—and a few eastern hotspots—show higher fluoride because of slow water-rock reactions, arid-basin evaporation, and geothermal mixing.The conversation moves from kitchen sinks to desert basins, old groundwater, volcanic sediments, warm deep wells, and the practical question every private well user should hear: testing is the only way to know what is in your own water.Citation: McMahon, P.B., Brown, C.J., Johnson, T.D., Belitz, K., and Lindsey, B.D. (2020). “Fluoride occurrence in United States groundwater.” Science of the Total Environment, 732, 139217. https://doi.org/10.1016/j.scitotenv.2020.139217Disclosure: This Waterlines episode package is designed for production with AI-generated voices.Full citation: McMahon, P.B., Brown, C.J., Johnson, T.D., Belitz, K., and Lindsey, B.D. (2020). Fluoride occurrence in United States groundwater. Science of the Total Environment, 732, 139217. https://doi.org/10.1016/j.scitotenv.2020.139217
-
28
When Water Maps Guess Too High and Too Low: Fixing Machine Learning Bias in Groundwater Science
Takeaway: A groundwater model can be right on average but still blur the cleanest and most concerning wells, so scientists have to check the whole spread, not just the middle.Groundwater maps help communities decide where drinking water may need treatment, where aquifers are vulnerable, and which hidden parts of the landscape deserve a closer look. But even smart machine-learning models can make a very human-sounding mistake: they smooth out the extremes. Low values can look too high, and high values can look too low. In this episode, we unpack a USGS study that tested six ways to correct that bias in groundwater-quality predictions, using examples like pH, nitrate, and iron. The conversation stays practical: why tails of a distribution matter, why a model can look “right on average” and still mislead, and how a correction method called empirical distribution matching can help maps better reflect the water people actually sample from wells. We also talk about transformed data, the Duan smearing estimate, and the judgment call researchers face when deciding whether to judge a model in log-units or real concentration units. This episode uses AI-generated voices. Citation: Belitz, K., & Stackelberg, P.E. (2021). Evaluation of six methods for correcting bias in estimates from ensemble tree machine learning regression models. Environmental Modelling and Software, 139, 105006. https://doi.org/10.1016/j.envsoft.2021.105006.
-
27
Finding Water’s Address: A New Map for Groundwater Clues
Takeaway: A well or field has a water address too: its place between creeks, divides, headwaters, rivers, and coasts can help explain what groundwater is like beneath it.When a community asks whether its wells are vulnerable, the answer often starts with a deceptively simple question: where is this place in the water system? Not just its street address, but whether it sits near a tiny headwater stream, beside a major river, close to a divide, or far from the coast. This episode explores a U.S. Geological Survey effort to give every 30-meter patch of the conterminous United States a kind of hydrologic address.The paper introduces multi-order hydrologic position, or MOHP: a set of map-based measurements that describe how a location sits within stream networks of different sizes. The idea is practical. Groundwater quality is hard to map everywhere because wells are scattered, geology is complicated, and water moves underground in ways we cannot see directly. But landscape position can offer clues. The authors mapped two measures—lateral position between stream and divide, and distance from stream to divide—across nine stream-network scales, producing 18 metrics for billions of map cells. They then tested whether those metrics helped machine-learning models reproduce known patterns such as physiographic regions, Central Valley geomorphic zones, and depth to the water table in Wisconsin.We talk through the everyday analogy of giving water a neighborhood map, why a small creek and a major river can both matter, what machine learning is doing here, and why the authors are careful not to claim the maps reveal every hidden process. The key lesson is grounded but powerful: location in a drainage network can help scientists organize messy groundwater information across very large areas.Citation: Belitz, K., Moore, R. B., Arnold, T. L., Sharpe, J. B., & Starn, J. J. (2019). Multi-Order Hydrologic Position in the Conterminous United States: A Set of Metrics in Support of Groundwater Mapping at Regional and National Scales. Water Resources Research. https://doi.org/10.1029/2019WR025908Disclosure: This Waterlines episode uses AI-generated voices for the host conversation.
-
26
When Water Models Meet the Real World: Why Useful Predictions Are Never Proof
Takeaway: A model can be a useful map of hidden water, but matching yesterday’s measurements does not prove it will be right tomorrow.When a town decides where to put a landfill, how to protect an aquifer, or whether a waste site will stay safe for centuries, computer models often sit quietly in the background. This episode asks a simple, high-stakes question: what can those models really promise? Using a classic paper from earth science, we explore why groundwater, climate, and geochemical models are powerful tools for thinking, testing, and planning, but not crystal balls that can be fully proven true.Hosts A and B unpack the difference between checking computer code, calibrating a model to known measurements, and claiming that a model has captured the real world. Along the way, they visit monitoring wells, hidden aquifers, missing data, and the messy problem of predicting water movement through rock that no one can see completely. The paper’s message is not anti-modeling. It is a practical guide to using models honestly: compare them with observations, ask where they fail, test alternatives, and be clear about uncertainty when public safety and environmental decisions are on the line.Full citation: Oreskes, N., Shrader-Frechette, K., & Belitz, K. (1994). Verification, validation, and confirmation of numerical models in the Earth Sciences. Science, 263(5147), 641–646. https://doi.org/10.1126/science.263.5147.641Disclosure: This Waterlines episode uses AI-generated voices.
-
25
Counting Groundwater Trouble Fairly: Why Aquifer Maps Need Grids, Not Guesswork
Takeaway: A few polluted wells do not tell us how much of an aquifer is affected unless the wells are spread across the underground map fairly.Groundwater problems often hide underground until they show up in a drinking-water well, and the way we count those problems can change what communities think is safe, rare, or widespread. This episode looks at a deceptively simple question: if a contaminant is found in some wells, how much of the aquifer is actually affected? We follow a USGS-led study that turns that question into a practical sampling approach using equal-area grids, careful statistics, and California case studies. The conversation explains why clustered well data can mislead, how a grid can make a regional assessment fairer, why uncertainty matters, and what it means to detect a small contaminant target in a big underground water system. Citation: Belitz, K., B. Jurgens, M. K. Landon, M. S. Fram, and T. Johnson (2010), Estimation of aquifer scale proportion using equal area grids: Assessment of regional scale groundwater quality, Water Resources Research, 46, W11550, doi:10.1029/2010WR009321. This Waterlines episode uses AI-generated voices to present and discuss the science.Full citation: Belitz, K., B. Jurgens, M. K. Landon, M. S. Fram, and T. Johnson (2010), Estimation of aquifer scale proportion using equal area grids: Assessment of regional scale groundwater quality, Water Resour. Res., 46, W11550, doi:10.1029/2010WR009321.
-
24
Methane in the Well: Measuring Britain’s Groundwater Before Shale Gas
Takeaway: Britain’s aquifers already carried a little methane before shale gas development, but this survey found it was usually only a trace and nowhere near the level that triggers action.Groundwater can carry invisible gases long before any new industry arrives, and that matters when communities, regulators, and energy companies later ask: “Did something change?” In this episode, we follow British Geological Survey scientists as they build a before-the-fact picture of dissolved methane in aquifers across England, Scotland, and Wales. The story is not about panic in the tap; it is about careful baseline science—knowing what is already there so future claims can be tested against evidence.We unpack why methane in water is different from many drinking-water concerns: it is not known as a direct ingestion hazard, but it can escape from water into enclosed spaces, where it may create explosion or asphyxiation risks at high levels. The team sampled 343 borehole sites, many in areas where unconventional gas development could one day be considered. They found methane in all sampled aquifers, usually at very low concentrations: most sites were below 10 micrograms per liter, and none reached the commonly cited 10,000 micrograms per liter action level. We also talk about why sampling method matters, why fractured rocks can give jumpier readings, and why “natural” background methane is still important to measure.Citation: Bell, R.A., Darling, W.G., Ward, R.S., Basava-Reddi, L., Halwa, L., Manamsa, K., & Ó Dochartaigh, B.E. (2017). A baseline survey of dissolved methane in aquifers of Great Britain. Science of the Total Environment, 601–602, 1803–1813. https://doi.org/10.1016/j.scitotenv.2017.05.191Disclosure: This Waterlines episode package is based on the paper above and is designed for production with AI-generated voices.
-
23
What Public Wells Reveal About America’s Groundwater
Takeaway: The water pumped from a public well carries the memory of the rocks it moved through, so natural geology can matter as much as nearby pollution.Groundwater is the quiet backup system under many American towns and cities: it fills public wells, supports growth, and often looks clean long before anyone tests what is dissolved inside it. This episode follows a nationwide USGS assessment that sampled major aquifers used for public supply and found an important twist: many of the most common drinking-water concerns in untreated groundwater come from rocks and sediments themselves, not only from farms, factories, or cities.We unpack how researchers sampled 25 principal aquifers across the continental United States, why they tested for hundreds of regulated and unregulated constituents, and what it means when a contaminant is found in source water rather than at the tap. Along the way, we translate terms like “geogenic,” “prevalence,” and “human health benchmark” into everyday language, and we look at why arsenic, manganese, strontium, radium, nitrate, and other constituents show up differently depending on geology, water age, chemistry, and land use.The practical message is not panic; public water systems often treat or blend water before it reaches homes. But the paper shows why knowing the aquifer matters, why unregulated naturally occurring constituents deserve attention, and why a well is never just a pipe in the ground - it is a sampling point in a long underground story.Citation: Belitz, K.; Fram, M. S.; Lindsey, B. D.; Stackelberg, P. E.; Bexfield, L. M.; Johnson, T. D.; Jurgens, B. C.; Kingsbury, J. A.; McMahon, P. B.; Dubrovsky, N. M. Quality of Groundwater Used for Public Supply in the Continental United States: A Comprehensive Assessment. ACS ES&T Water 2022, 2, 2645-2656. https://doi.org/10.1021/acsestwater.2c00390.Disclosure: This Waterlines episode package is written for public-science audio production and uses AI-generated voices.
-
22
How Deep Is the Rock Beneath the Delaware River Basin?
Takeaway: A noisy bedrock map can still be useful if it gets the basin-scale pattern right, not every exact backyard.Knowing where solid bedrock begins is not just a geology puzzle. It shapes where groundwater can move, how wells behave, how roads and bridges are planned, and how regional water models estimate what a basin can store and supply. In this episode, we visit the Delaware River Basin through a deceptively simple question: how deep do you have to go before loose earth becomes rock?The paper follows U.S. Geological Survey researchers using machine learning to map depth to bedrock from more than 72,000 observations. But the real story is about uncertainty. Well logs are rounded, locations can be approximate, drillers may describe materials differently, and the underground surface itself can change sharply over short distances. Instead of pretending the data are perfectly clean, the researchers ask a practical question: at what scale is the model actually useful?We unpack their three-part model check: exact point-by-point accuracy, whether the predicted spread of values looks like the real spread, and whether the map captures realistic spatial patterns across the basin. The result is a useful lesson for environmental science in the age of AI: a model that looks weak at a single address may still be strong enough for basin-scale planning, if it is tested at the scale of the decision.Citation: Goodling, P., Belitz, K., Stackelberg, P., & Fleming, B. (2024). A spatial machine learning model developed from noisy data requires multiscale performance evaluation: Predicting depth to bedrock in the Delaware river basin, USA. Environmental Modelling & Software, 179, 106124. https://doi.org/10.1016/j.envsoft.2024.106124Disclosure: This Waterlines episode uses AI-generated voices for the host conversation.
-
21
Why Big Water Models Can Miss Small Streams
Takeaway: If the map squares are too big, a model can turn a living web of headwater streams into a blur, even before the water math begins.A national water model is a little like a weather map for groundwater: it helps people see patterns too large to notice from one well, one creek, or one town. But every model has a grain, and this episode asks a wonderfully practical question: how big can the squares on that map be before small streams disappear into the blur? We follow a USGS team as they test how grid-cell size changes the way stream networks are represented across 18 river basins in the conterminous United States, from the Delaware to the San Joaquin to southern Florida. The result is a clear lesson for anyone who cares about drought planning, groundwater pumping, streamflow, wetlands, fish habitat, or climate-ready water decisions: before the equations start, the map itself can decide what water connections are visible. Citation: Fleming, B.J., Belitz, K., and Killian, C.D. 2025. Consideration of Grid Cell Size to Represent Stream Networks for the Conterminous United States. Groundwater 63, no. 3: 301–305. https://doi.org/10.1111/gwat.13484. This Waterlines episode uses AI-generated voices to present and discuss the science.
-
20
When Old Oil Wells Leak Into Groundwater: Methane, Microbes, and the Hidden Chemistry Below
Takeaway: Water quality problems often begin out of sight, in small mixtures and slow reactions.Abandoned oil and gas wells are often discussed as climate problems because they can leak methane to the air. But this episode follows a quieter path: what happens when that methane, salty deep water, and shallow groundwater meet underground. In northwestern Pennsylvania, researchers sampled water flowing from or near legacy wells and found that old wellbores can act like hidden straws, connecting deep formations to aquifers. The surprising twist is microbial: tiny organisms can “breathe” methane without oxygen, changing water chemistry and sometimes helping mobilize iron, manganese, and trace metals such as arsenic.We unpack how field sampling, dissolved gas fingerprints, microbial DNA, lab incubations, and a reactive transport model all fit together. Along the way, we explain why methane in water is not just about bubbles, why rusty orange seeps can signal deeper chemistry, and why the same leak can produce metal-rich water in one place and sulfide-smelling water in another. The practical stakes are local water quality, abandoned well cleanup, and how society manages the long afterlife of fossil fuel infrastructure.Citation: Shaheen, S. W., Lloyd, M. K., Roden, E. E., & Brantley, S. L. (2025). Anaerobic oxidation of methane from abandoned oil and gas wells leaking into aquifers. Geochimica et Cosmochimica Acta, 408, 269–282. https://doi.org/10.1016/j.gca.2025.08.039Disclosure: This Waterlines episode package is written for public science communication and is intended for production using AI-generated voices.
-
19
The Hidden Nitrate Map Beneath Our Drinking Water
A glass of tap water can look perfectly clear and still carry a story from farm fields, soils, rainfall, rock layers, and decades of land use. This episode matters because groundwater supplies drinking water for millions of people, including many rural households with private wells, and nitrate is one of the most common contaminants that can make that water unsafe. We unpack how researchers used machine learning to make a national, three-dimensional map of nitrate risk in groundwater across the lower 48 states, and what that map can and cannot tell a family, water utility, or local decision-maker.Hosts A and B explain nitrate in plain language, why depth matters, why some aquifers are more vulnerable than others, and how a model called extreme gradient boosting can learn patterns from more than 12,000 wells without becoming a crystal ball. The conversation also explores SHAP, a tool the scientists used to ask the model which factors mattered most, from well depth and soil drainage to manure, fertilizer, precipitation, and land use. The big takeaway: high nitrate was predicted in only about 1 percent of the mapped groundwater-supply area, but roughly 1.4 million equivalent people rely on groundwater in those areas.Citation: Ransom, K.M., Nolan, B.T., Stackelberg, P.E., Belitz, K., and Fram, M.S. (2022). Machine learning predictions of nitrate in groundwater used for drinking supply in the conterminous United States. Science of the Total Environment, 807, 151065. https://doi.org/10.1016/j.scitotenv.2021.151065Disclosure: This Waterlines episode package is written for public-science communication and uses AI-generated voices for the host dialogue.
-
18
What’s in the Well? Pesticide Breakdowns in U.S. Drinking-Water Aquifers
Groundwater can feel out of sight and out of mind, but it is the hidden source for many public drinking-water systems. This episode follows a national USGS study that asks a practical question: when pesticides move through soil and rock, what shows up in the raw groundwater before treatment, and what might it mean for health?We unpack why pesticide “degradates” matter. These are breakdown products formed as chemicals weather underground, and they can be easier to miss than the original pesticide. The study sampled 1,204 public-supply wells and springs across major U.S. aquifers, testing for 109 pesticide active ingredients and 116 degradates. Pesticide compounds appeared in 41% of wells, often as mixtures, and degradates were common. But the health-context finding is important and reassuring: concentrations were generally low. None exceeded health-based benchmarks, and after a careful screening process, only 1.6% of wells had totals approaching levels of potential concern.The conversation keeps the science grounded: what a “raw” water sample is, why shallow and recently recharged groundwater is more vulnerable, how researchers compare tiny concentrations with health benchmarks, and why uncertainty remains for compounds that lack toxicity data. We also talk about what listeners can do with this information, from reading local water reports to understanding the difference between public-supply monitoring and private wells.Citation: Bexfield, Laura M.; Belitz, Kenneth; Lindsey, Bruce D.; Toccalino, Patricia L.; Nowell, Lisa H. “Pesticides and Pesticide Degradates in Groundwater Used for Public Supply across the United States: Occurrence and Human-Health Context.” Environmental Science & Technology 2021, 55, 362–372. https://doi.org/10.1021/acs.est.0c05793Disclosure: This Waterlines episode package is written for production with AI-generated host voices.
-
17
California’s Groundwater Checkup: Measuring Risk by Place and by People
Groundwater is easy to forget because it is out of sight, but millions of people depend on it every day. This episode follows a statewide California effort to answer a deceptively simple question: when a well test finds a problem, how do we describe the size of that problem fairly? Is it the number of wells, the amount of aquifer area affected, or the number of people who rely on that water? We unpack how USGS scientists used data from about 11,000 public-supply wells across 87 study areas to build two clearer yardsticks: affected area and equivalent-population. Along the way, we talk about arsenic, uranium, manganese, nitrate, solvents, farm chemicals, urban history, and why groundwater quality is not the same everywhere, even inside one state. The study found that roughly one-fifth of California groundwater used for public supply had high concentrations of at least one constituent, with trace elements more widespread than nitrate or organic compounds at statewide scales. We also look at what this does and does not mean for tap water, since utilities may blend or treat water before delivery. Citation: Belitz, K.; Fram, M. S.; Johnson, T. D. “Metrics for Assessing the Quality of Groundwater Used for Public Supply, CA, USA: Equivalent-Population and Area.” Environmental Science & Technology 2015, 49, 8330–8338. https://doi.org/10.1021/acs.est.5b00265. Disclosure: this Waterlines episode package is written for production with AI-generated voices.
-
16
Who Gets Tap Water from Underground? Mapping America’s Public-Supply Groundwater
Turn on a kitchen faucet and the water may have traveled from a river, a reservoir, or a well drilled into layers of sand, gravel, limestone, or fractured rock. That hidden geography matters: it shapes which communities depend on which aquifers, which water sources need protection, and who may be affected when drought, contamination, or growth puts pressure on groundwater.In this episode, we unpack a national USGS mapping study that asks a deceptively simple question: where are the people who get public drinking water from groundwater, and which underground water-bearing regions supply them? The team combined census data, public water-use records, land-use maps, and tens of thousands of public-supply well records to build a high-resolution picture of public-supply groundwater in the conterminous United States in 2010.The headline numbers are striking but practical: about 269 million people used public-supply water; about 107 million of them were supplied by groundwater and about 162 million by surface water. When private-well users are included, the study estimates that roughly 144 million people—about 47% of the conterminous U.S. population in 2010—relied on groundwater. The episode explains how the researchers mapped people to places, why they created 177 hydrogeologic mapping units, and what it means that stacked aquifers can supply the same community from different depths.Citation: Johnson, T.D., Belitz, K., Kauffman, L.J., Watson, E., & Wilson, J.T. (2022). Populations using public-supply groundwater in the conterminous U.S. 2010; Identifying the wells, hydrogeologic regions, and hydrogeologic mapping units. Science of the Total Environment, 806, 150618. https://doi.org/10.1016/j.scitotenv.2021.150618Disclosure: This Waterlines episode uses AI-generated voices for the hosts. The scientific discussion is based on the cited paper and is written for public understanding, not as a substitute for local water-system guidance.
-
15
When Wetlands Whisper and Groundwater Speaks: Tracking Chemistry in a Flat Michigan Stream
Flat, wetland-rich streams can look quiet from the road, but they help decide what nutrients, salts, and carbon move through our landscapes and into bigger rivers. That matters for drinking water, farm country, wetland protection, climate-linked carbon cycling, and how communities monitor water quality. In this episode of Waterlines, we visit Augusta Creek in southwest Michigan, where scientists sampled the same stream network again and again for nearly three years to ask a deceptively simple question: when stream chemistry changes, is the story written by wetlands on the surface, or by groundwater moving underground?The surprise is that both matter, but not in the same places. Wetlands left clear chemical fingerprints in small headwater areas. Farther downstream, those signals were often muted by strong groundwater inputs that made the stream chemistry more stable than expected across seasons. We unpack what dissolved organic carbon, nitrate, sulfate, and chloride can tell us; why sampling many places at the same time is like taking repeated “snapshots” of a watershed; and why flat landscapes may not behave like the mountain streams that shaped much of classic stream science.Paper featured: Weidner, C. R., Zarnetske, J. P., Kendall, A. D., Martin, S. L., Nesheim, S., & Shogren, A. J. (2025). Wetlands, groundwater and seasonality influence the spatial distribution of stream chemistry in a low‐relief catchment. Journal of Geophysical Research: Biogeosciences, 130, e2025JG008989. https://doi.org/10.1029/2025JG008989Disclosure: This Waterlines episode uses AI-generated voices to present and explain the science in an accessible conversation format.
-
14
The Water Cycle Picture Is Missing Us
Every schoolkid learns the water cycle: sun, cloud, rain, river, ocean, repeat. But that familiar picture quietly shapes how adults think about dams, drought, pollution, farming, climate change, and who gets water in a crisis. This episode asks a surprisingly practical question: what happens when the most common map of water on Earth leaves people almost entirely out?We unpack a Nature Geoscience study that compared modern estimates of global water stores and flows with hundreds of water-cycle diagrams from textbooks, agencies, classrooms, and web searches around the world. The researchers found that human freshwater appropriation is now roughly equal to half of global river discharge, yet only 15% of diagrams showed humans interacting with the water cycle. Pollution and climate change appeared in only about 2% or less. Most diagrams also showed one neat watershed, which hides the way forests, farms, oceans, cities, and distant winds connect water across continents.Hosts A and B turn the paper into an everyday conversation: why a simple classroom image can influence policy, why groundwater is not an endless savings account, what green, blue, and grey water mean, and how better pictures could help communities think more honestly about scarcity, floods, food, and shared responsibility.Citation: Abbott, B. W., Bishop, K., Zarnetske, J. P., Minaudo, C., Chapin III, F. S., Krause, S., Hannah, D. M., Conner, L., Ellison, D., Godsey, S. E., Plont, S., Marçais, J., Kolbe, T., Huebner, A., Frei, R. J., Hampton, T., Gu, S., Buhman, M., Sayedi, S. S., Ursache, O., Chapin, M., Henderson, K. D., & Pinay, G. (2019). Human domination of the global water cycle absent from depictions and perceptions. Nature Geoscience, 12, 533–540. https://doi.org/10.1038/s41561-019-0374-yDisclosure: This Waterlines episode package is written for production with AI-generated host voices.
-
13
What Salt Can Tell Us About a Well: Reading Groundwater in Southern Quebec
A glass of well water can look perfectly clear and still carry a hidden story from ancient seas, road salt, bedrock, clays, and slow underground flow. This episode matters because millions of people rely on private wells, and testing every possible chemical is expensive. We explore a practical question: can one easy field measurement give homeowners and water managers an early clue about what else may be in groundwater?The paper takes us to Southern Quebec, where researchers used 2,608 groundwater samples from a large public knowledge program. They sorted the samples by chloride, a common marker of salinity, then watched how 12 other dissolved ingredients changed along that saltiness scale: bicarbonate, sulfate, calcium, magnesium, sodium, potassium, boron, barium, strontium, silicon, manganese, and fluoride. Their key insight is not that chloride explains everything, but that it often travels with a broader chemical shift. Low-salt waters tended to look more like calcium-bicarbonate groundwater; high-salt waters shifted toward sodium-chloride water, with some elements rising along the way.We talk through how a simple electrical conductivity reading, taken in the field, can be converted into an estimated chloride level and used as a rough chemical profile. We also emphasize the limits: this is a regional, empirical model, not a replacement for drinking-water testing, and high-salinity samples were fewer than low-salinity ones. Still, it offers a powerful public-science lesson: groundwater quality is shaped by geology, history, and human choices, and sometimes a single signal can help us ask better questions.Citation: Boumaiza, L., Walter, J., Chesnaux, R., Stotler, R. L., Wen, T., Johannesson, K. H., Brindha, K., & Huneau, F. (2022). Chloride-salinity as indicator of the chemical composition of groundwater: empirical predictive model based on aquifers in Southern Quebec, Canada. Environmental Science and Pollution Research. https://doi.org/10.1007/s11356-022-19854-zDisclosure: This Waterlines episode package is written for public science communication and uses AI-generated voices for the hosts.
-
12
When Rivers Get Saltier: Climate, Road Salt, and the Future Chemistry of U.S. Freshwater
A glass of tap water, a winter road, a farm field, and a trout stream are all connected by river chemistry. This episode asks a practical climate question: as the U.S. warms, will freshwater become saltier, less buffered, or simply different in ways communities need to plan for? We follow a new study that used long-running river records and machine learning to look ahead from 2040 to 2100, linking sodium, alkalinity, road salt, rainfall, population, and bedrock geology across 226 U.S. river sites.Hosts A and B unpack why northern rivers may see lower sodium flux as warmer winters reduce road-salt use, why warmer and drier southern and western regions could still face soil-salinity risks, and why alkalinity behaves differently depending on the rocks beneath a watershed. Along the way, they explain sodium as a salinity signal, alkalinity as water’s acid-buffering capacity, and random forest models as many simple decision trees voting together. The episode also covers what the models do well, where uncertainty remains, and why monitoring stations and open data matter for water managers.Citation: E, Beibei, Shuang Zhang, Elizabeth Carter, Tasmeem Jahan Meem, and Tao Wen. 2025. “Predicting salinity and alkalinity fluxes of U.S. freshwater in a changing climate: Integrating anthropogenic and natural influences using data-driven models.” Applied Geochemistry 180: 106285. https://doi.org/10.1016/j.apgeochem.2025.106285.Disclosure: This Waterlines episode uses AI-generated voices for the host conversation.
-
11
Reading Rivers in Mud: How AI Helps Decode Sediment and Climate Stories
A handful of mud can hold the memory of a river flood, a lake edge, or a dust storm that crossed a continent. That matters because sediments are one of the main ways water leaves a record of past environments, climate shifts, and landscape change. In this episode of Waterlines, we unpack a new study that asks a practical question: if scientists use grain size to read those records, how can they reduce the human guesswork built into the methods?The paper follows 73,393 sediment samples from loess, river, and lake-delta settings, mostly in China and Central Asia. The authors use an existing grain-size decomposition approach to create training examples, then bring in deep learning, including convolutional neural networks and generative adversarial networks, to build a more consistent tool for separating mixed sediment into likely components. We explain the idea with everyday analogies: sorting trail mix after it has been shaken together, reading the energy of water from sand and silt, and teaching a model with both real and carefully generated examples.We also talk about what the work does not solve. The model performed well where training data matched the new samples, but struggled where loess from Central Asia differed from loess on the Chinese Loess Plateau. That limitation is important: AI does not remove the need for field knowledge, shared data, and careful interpretation. It may, however, help scientists compare sediment records more fairly across river basins, lakes, deserts, and ancient climate archives.Citation: Liu, Y., Wang, T., Wen, T., Zhang, J., Liu, B., Li, Y., Zhang, H., Rong, X., Ma, L., Guo, F., Liu, X. and Sun, Y. (2024) Deep learning-based grain-size decomposition model: A feasible solution for dealing with methodological uncertainty. Sedimentology. doi: 10.1111/sed.13195.Disclosure: This Waterlines episode package is written for public science communication and is intended to be performed with AI-generated voices.
-
10
When Water Data Speak Different Languages: Why Nitrate Units Matter
Clean water decisions often depend on numbers in a database: a nitrate reading from a farm well, a phosphate measurement from a river, a trend line warning of algae blooms. But what if those numbers use different naming habits, missing units, or labels that can be misunderstood? This episode looks at a deceptively simple problem with big consequences: water-quality data are easier to share than ever, but not always easy to trust or combine.Hosts A and B unpack a short Environmental Science & Technology Viewpoint arguing that researchers, agencies, and labs can make water data more useful by following three practical rules: use the most common reporting format when possible, choose the safer convention when mistakes could affect health, and remove ambiguity from names and units. Along the way, they explain why “nitrate” can mean different things depending on whether it is reported “as nitrogen” or “as nitrate,” how duplicate records can sneak into large databases, and why a small wording choice can change a drinking-water interpretation.Citation: Shaughnessy, Andrew R.; Wen, Tao; Niu, Xianzeng; and Brantley, Susan L. “Three Principles to Use in Streamlining Water Quality Research through Data Uniformity.” Environmental Science & Technology, 2019, 53(23), 13566–13567. DOI: 10.1021/acs.est.9b06406.Disclosure: This Waterlines episode package is written for public science communication and uses AI-generated voices for the hosts.
-
9
Reading Deep Heat in Mexico’s Geothermal Water
Geothermal power sounds simple: bring hot water up, make electricity, send cooled brine back down. But underground, that loop can change where fluids flow, where steam forms, and how long a reservoir can keep giving heat. This episode visits Mexico’s Los Azufres geothermal field, where scientists used tiny traces of noble gases and strontium in water and steam to ask very practical questions: Where is the heat coming from? How has decades of production and reinjection changed the field? And what can invisible atoms tell us about managing clean energy below our feet?We explain why helium can act like a postcard from young magma, why argon and xenon can reveal boiling and recycled brine, and how strontium helps connect fluids to the rocks they touched. The study found strong mantle helium signals, evidence for young magmatic heat sources likely less than 50,000 years old, and signs that injected used brines have spread through parts of the reservoir while the boiling zone expanded north and west since earlier sampling.Citation: Wen, T., Pinti, D. L., Castro, M. C., López-Hernández, A., Hall, C. M., Shouakar-Stash, O., & Sandoval-Medina, F. (2018). A noble gas and 87Sr/86Sr study in fluids of the Los Azufres geothermal field, Mexico – Assessing impact of exploitation and constraining heat sources. Chemical Geology, 483, 426–441. https://doi.org/10.1016/j.chemgeo.2018.03.010Disclosure: This Waterlines episode package is written for public science communication and uses AI-generated voices for the host conversation.
-
8
When Methane Finds a Water Well: Tracking Gas Leaks in Shale Country
When people turn on a kitchen tap, they are trusting a hidden system of rock, fractures, wells, microbes, and chemistry. This episode matters because methane in groundwater is not only a household safety concern; it is also a clue to how energy development, geology, and water protection intersect. We visit Sugar Run in Pennsylvania, where researchers studied bubbling seeps, private wells, stream water, and the layered rocks beneath them to understand why methane sometimes appears near hydraulically fractured shale gas wells—and how to tell a new problem from an older, natural one.The conversation turns advanced geochemistry into plain language: methane and ethane as fingerprints, noble gases as tiny travel tags, isotopes as origin clues, and iron and sulfate as signs that microbes are reacting to new gas underground. We also talk about uncertainty: the paper does not prove one single well caused every observation, and methane can occur naturally in this region. But the study offers a practical way to think about riskier geologic settings and better monitoring.Citation: Woda, J., Wen, T., Oakley, D., Yoxtheimer, D., Engelder, T., Castro, M. C., & Brantley, S. L. (2018). Detecting and explaining why aquifers occasionally become degraded near hydraulically fractured shale gas wells. Proceedings of the National Academy of Sciences, 115(49), 12349–12358. https://doi.org/10.1073/pnas.1809013115Disclosure: This Waterlines episode uses AI-generated voices for the hosts.
We're indexing this podcast's transcripts for the first time — this can take a minute or two. We'll show results as soon as they're ready.
No matches for "" in this podcast's transcripts.
No topics indexed yet for this podcast.
Loading reviews...
ABOUT THIS SHOW
✦ Waterlines: How Water Shapes Our World ✦ explores the hidden role of water in shaping our planet, ecosystems, and daily lives. Each episode turns advanced water science into engaging, everyday conversationsDesigned for curious listeners — no scientific background required — the show features researchers, field stories, and real-world challenges that reveal why water matters more than we think. Whether you’re interested in the environment, climate, or how science connects to society, Waterlines helps you see the world through the lens of water.
HOSTED BY
jaywen
Loading similar podcasts...
Frequently Asked Questions
How many episodes does Waterlines: How Water Shapes Our World have?
Waterlines: How Water Shapes Our World currently has 50 episodes available on PodParley. New episodes are automatically indexed when they're published to the podcast feed.
What is Waterlines: How Water Shapes Our World about?
✦ Waterlines: How Water Shapes Our World ✦ explores the hidden role of water in shaping our planet, ecosystems, and daily lives. Each episode turns advanced water science into engaging, everyday conversationsDesigned for curious listeners — no scientific background required — the show features...
How often does Waterlines: How Water Shapes Our World release new episodes?
Waterlines: How Water Shapes Our World has 50 episodes. Check the episode list to see recent publication dates and frequency.
Where can I listen to Waterlines: How Water Shapes Our World?
You can listen to Waterlines: How Water Shapes Our World on PodParley by clicking any episode. We provide an embedded audio player for direct listening, and you can also subscribe via your preferred podcast app using the RSS feed.
Who hosts Waterlines: How Water Shapes Our World?
Waterlines: How Water Shapes Our World is created and hosted by jaywen.
URL copied to clipboard!