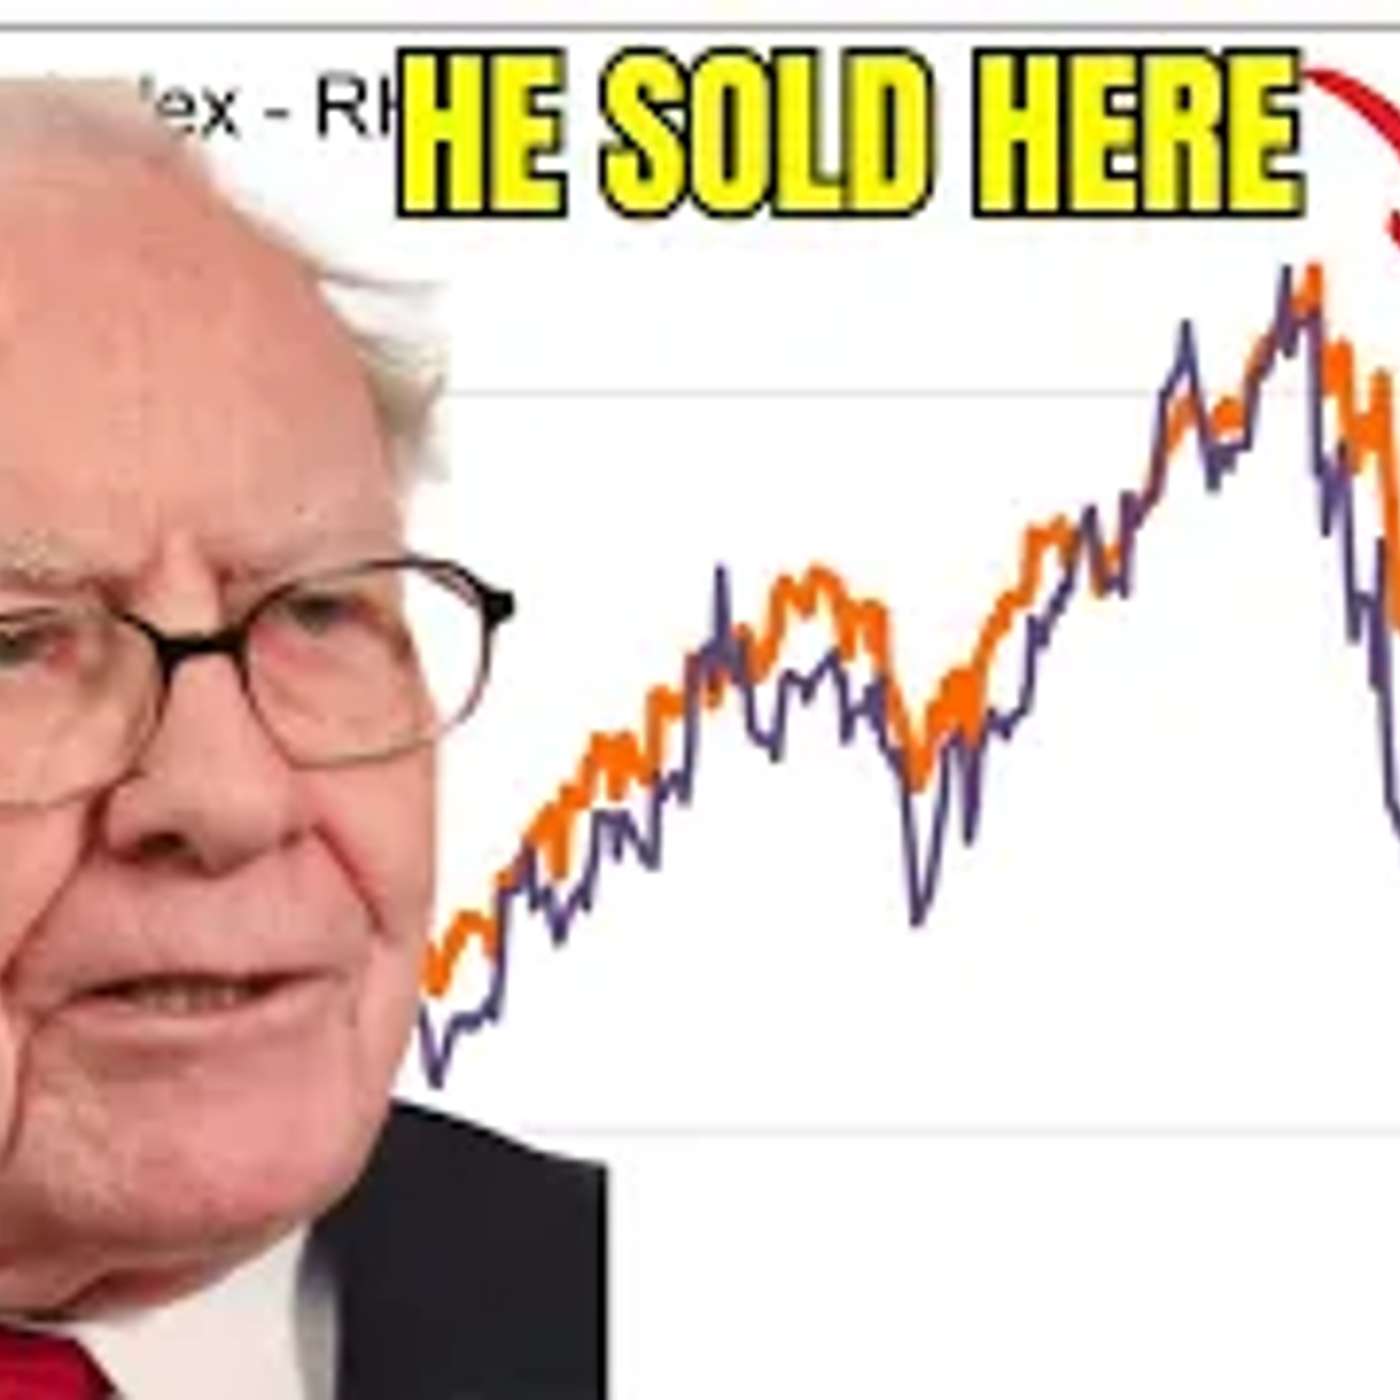
This Chart Explains Why Warren Buffett Is Panic Selling
from Eurodollar University Hosted by Jeff Snider
Warren Buffett continues to sell tens of billions worth of stocks. Everyone wants to know why. This divergence between major stock index most likely holds the answer. Normally stock indexes don't mean much beyond their beauty, yet they can be important signals at times like now when they do diverge in such an obvious and sustained way. This is a key cyclical one, too. Eurodollar University's Money & Macro Analysis CNBC Berkshire Hathaway’s cash fortress tops $300 billion as Buffett sells more stock, freezes buybacks https://www.cnbc.com/2024/11/02/berkshire-hathaways-cash-fortress-tops-300-billion-as-buffett-sells-more-stock-freezes-buybacks.html Franklin-Templeton https://www.franklintempleton.com/articles/equity-markets/the-foundry-quandary-owning-semis-late-in-the-cycle Deloitte Industry Outlook https://www2.deloitte.com/us/en/pages/technology-media-and-telecommunications/articles/semiconductor-industry-outlook.html https://www.eurodollar.university Twitter: https://twitter.com/JeffSnider_EDU
Embed this episode
No transcript yet.