
EPISODE · Nov 9, 2016 · 41 MIN
Visualizing Data with D3.js (LIVE)
from Siraj Raval
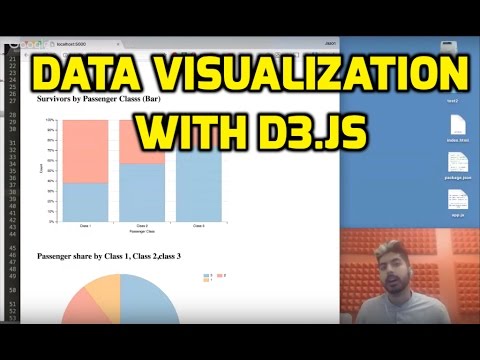
In this session, I'm going to show you how to visualize data using the popular data visualization library (D3.js). This is useful for showing your results from machine learning algorithms, or just for you to understand what your data looks like. We visualize survivor stats from the popular Kaggle Titanic Survivor dataset. The code in this video can be found here: https://github.com/llSourcell/D3_Data_visualization_live Please support me on Patreon! I want to continue to do this Youtube channel full-time: https://www.patreon.com/user?u=3191693 Comment, Like, and Subscribe! That's what keeps me going. :) Follow me: Twitter: https://twitter.com/sirajraval Facebook: https://www.facebook.com/sirajology Instagram: https://www.instagram.com/sirajraval/ Instagram: https://www.instagram.com/sirajraval/
What this episode covers
In this session, I'm going to show you how to visualize data using the popular data visualization library (D3.js). This is useful for showing your results from machine learning algorithms, or just for you to understand what your data looks like. We visualize survivor stats from the popular Kaggle Titanic Survivor dataset. The code in this video can be found here: https://github.com/llSourcell/D3_Data_visualization_live Please support me on Patreon! I want to continue to do this Youtube channel full-time: https://www.patreon.com/user?u=3191693 Comment, Like, and Subscribe! That's what keeps me going. :) Follow me: Twitter: https://twitter.com/sirajraval Facebook: https://www.facebook.com/sirajology Instagram: https://www.instagram.com/sirajraval/ Instagram: https://www.instagram.com/sirajraval/
NOW PLAYING
Visualizing Data with D3.js (LIVE)
No transcript for this episode yet