Weekly Portfolio Updates | NEW MONTHLY PICKS
from The Saturday Sendout Hosted by The Simple Side
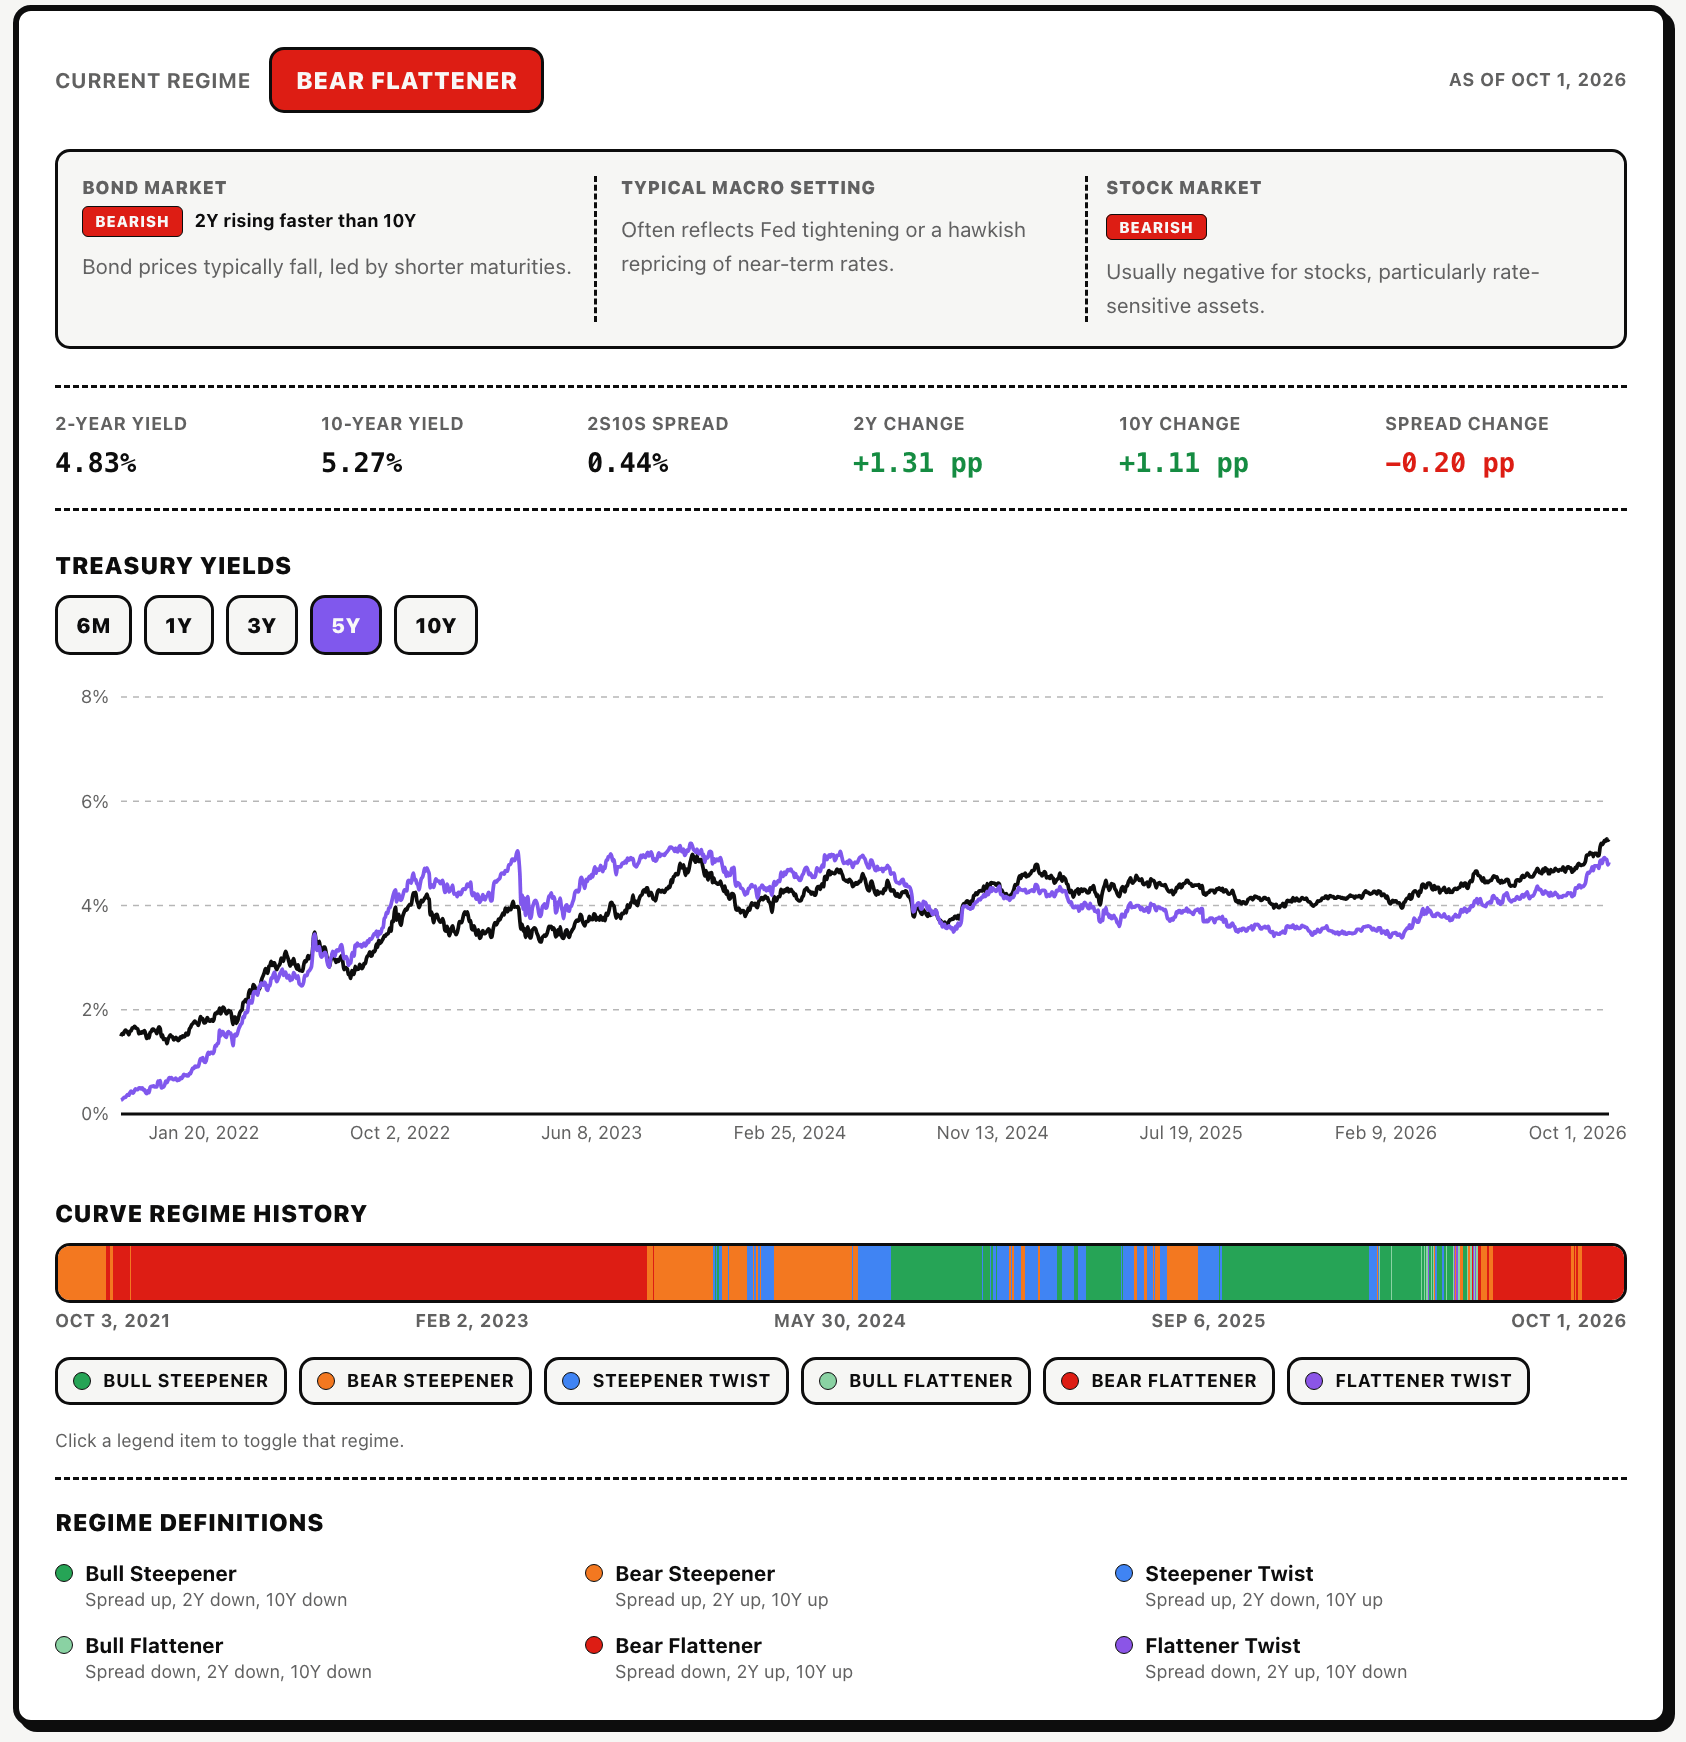
This is a free preview of a paid episode. To hear more, visit thesimpleside.substack.com 13 Retirement Investment Blunders to Avoid Download our guide to avoiding investment mistakes to learn key ways to keep your retirement on track. Download Now Quick Notes Everybody, I have been gone for a little bit, but I am back with another market update, an update on portfolios, trades, and all of that stuff. We have some new stock picks that we made for our monthly portfolio, and we have some thoughts about the general market that are probably a bit contrarian. Let’s talk about it. Like I said, welcome back to another portfolio update, a weekend update from The Simple Side. This one, of course, is coming after two weeks of hearing nothing from me, so I apologize for that. But I promise I had good reason. I was at a healthcare conference in Dallas for a while, and then I was actually moving into a new house. My wife and I are expecting our first child in March of next year, so there is a lot going on in preparation for all of those things. Regardless, we’re back, and we’ve got a bunch of updates for you. We’re going to jump into these quickly today. I’m going to run through everything and talk about how I’m thinking about the current market. I also had a good realization over the past couple of weeks that I want to talk about. We updated our new monthly stock picks as of October 1, and we had some new quarterly picks in certain portfolios that were changed or added as well. So we’ll take a look at those. Market Crash Signals: Don’t Worry As always, I just want to say: if you’re concerned about a stock market crash right now, even though everybody seems to be proclaiming, “The market’s coming down, the market’s coming down. Humpty Dumpty’s on the wall,” stop worrying. I really would not be nervous or upset about it. Of course, I’m not saying that a crash could not happen. A crash could always happen. It could come at any time. There could always be a bubble that we don’t know about. But I don’t think it’s worth sitting around waiting for a crash just because the economy looks weird. That’s not a good investment strategy. I say this to you, but this is also the realization I had over the past couple of weeks. I’m saying it to myself as well. Price Action: Trend Is Friend I have been heavily uninvested in general when it comes to the stock market for the majority of this year. I would say nearly 20%-30% of my investments have sat in cash or cash equivalents in some way, shape, or form, and it’s basically for the reasons that I just told you not to worry about. I thought the economy looked rough. I thought Trump’s random decision-making, whether you agree or disagree, made things look more volatile and more risk-off, and I just thought that, in general, the market looked overvalued. I thought if you went and looked at the Buffett Indicator, Shiller P/E, Shiller forward P/E, and everything else, it all seemed so far overvalued that there was no way it could keep climbing. And now here we are, up roughly 13% so far in 2026 in the S&P 500. Of course, I was really wrong, but I’m glad I came to this realization now. The realization is basically this, if I could sum it up: regardless of the macro or underlying conditions in the stock market, price action needs to be the thing that drives investment allocations within your portfolio. I’ll say that one more time. Regardless of the underlying macro conditions in the market, price action should drive the investment allocations within your portfolio — AKA, trend is friend. I think it’s very important to use macro indicators in conjunction with trend to find out whether or not a sell-off has any weight to it or if we think it could be expedited for whatever reason. However, price action must remain king. If you’re a bit confused by what I mean by price action, I’m going to use a quick example: The Trade Desk (TTD). I have a chart in the newsletter that you need to go look at. Again, thesimpleside.substack.com has all of this. I have a chart set up of The Trade Desk year-to-date. The stock is down 76% year to date, and I marked where you likely would have bought during the course of this past year if you were ignoring the price action and ignoring the trend. Regardless of where you would have bought, you would be down. The stock has continued down over and over again and has not made a new high once this year. The highest it was came around mid-January, and it has only declined since then. If you’re ignoring the trend, you might not be down 76% because you may have DCA’d, but you’ve continued to DCA downward. Maybe you’re down 60% or 50%, but you’re still down a ton. If you did use price action or trend and went and looked at this, you would see that there is nothing signaling any kind of momentum gain. There is no real way to look at this and say things are starting to climb again. Conversely, if you looked at the SPDR S&P 500 ETF Trust (SPY) this year and bought only on positive price action, there were really only a couple of months where you would have been buying, but you would be up on those prices. You would have positive returns. I put another chart in the newsletter showing SPY so far this year. You can see that from January through maybe April, we were basically flat. We kind of wavered between 650 and 700 on SPY. Eventually, we broke down below 650, and then we started to climb. I marked where you might have bought if you were following the trend, and no matter where you would have bought along the trend after April, those positions would be in the green right now. This is just a quick example of why we need to follow price action and why trend is, quote-unquote, “friend.” I wanted to show this to you because I’m frustrated that I didn’t catch this concept sooner. If I had, I probably would have allocated a lot more money into my portfolios earlier in the year. That being said, I’m very excited to be sharing this with you and finding all of this out now. This will be sitting in my toolbox for future use, and I want you to have it in your toolbox as well. Trend is friend. When the market is going down, you should not be looking to immediately buy in on any reduction in the overall value of the stock market. Just because something is going down doesn’t mean it’s going to reverse. In fact, it’s likely going to continue on the current path that it’s on, and a reversal might come later. You want to wait until that reversal happens and is solidified before you end up buying in. Regardless, it’s something to think about. What the Market Is Doing Now we can talk a bit more about the actual stock market. The S&P 500 this week did nothing crazy. It probably finished Friday about 1% below its all-time high and is still up roughly 13% this year. The Nasdaq is up about 17%. Meanwhile, all you can hear about is terrible sentiment around the economy. Consumer confidence just fell to 81.9, the lowest reading since 2014. This is something I’ve discussed before, but I’ll say it again: this can be a general signal that the broader market is beginning to sell off. Stocks continue to run while people remain convinced something terrible is right around the corner. That is something that often happens before the market actually turns. But again, this is not a predictive indicator. I wouldn’t go and sell your entire portfolio based on this. We have to wait for price action to prove to us that that’s what’s going on. And yes, there are reasons to be nervous. The S&P 500 has had this very steep climb. We’ve seen bears getting squeezed out of specific stocks, and fear has constantly hung around even while stock prices have been rising. Those are things I watch when I’m looking at the late stages of a big run. The market has been on a huge run. You could call it a huge run ever since 2020 or 2021 — just nothing but green. You can see it in the way the financial economy is shifting. All these copy-trading sites are popping up, and random people are making ridiculous bets and making a ton of money. That’s not necessarily a good thing. It’s a good thing now because people are making money and everything seems to be going up, so everybody seems to be doing well. But I think this is a signal that we’re in the late stages of a big run. That doesn’t mean the big run is over. It means we’re in the late stages. Again, nothing tells me I should wake up Monday morning and sell everything. Price action is very, very important. That price action matters more than somebody on TV screaming about a recession coming. But when the price does start to agree with the bearish argument, that’s when the rally might start to break down. It might start to get ugly at that point, and then we’ll get a little more defensive. We might move into a more cash-equivalent position in our portfolio or shift more of our assets to cash. For now, there is no reason to fight this rising tide. We will not win. So we’re going to continue to ride the wave. There is nothing to be extremely worried about as of Monday morning. Economic Backdrop With all that being said, we’ve got this weird combination in the economy. GDP grew at a 2.2% annual rate in the second quarter after 2.5% in the first quarter. Consumer spending and business investment were both positive. Americans increased spending by another roughly 1% in August, which is nowhere near something that would signal a recessionary economic environment. So I’m not worried about any of that stuff. However, while all of that good stuff is going on, payroll growth was only 29,000 in September. Unemployment moved up to 4.2%, and wage growth slowed to 3% from a year ago. People are still spending, businesses are still investing, and manufacturing is still expanding, but hiring is slowing a lot. Again, that shouldn’t come as any surprise with all of the new technological developments going on right now. I would call this the economy losing a bit of speed, but we’re nowhere near falling off a cliff. The bigger problem, I think, right now is inflation and the bond market. There is a lot happening here, and it’s dangerous. I would argue that it is not very controllable at the current moment. CPI in August was 3.4%. The Fed raised rates in September to a 3.75%-4.00% range. Oil is not helping any of this at all. I think Brent finished the week around $102 a barrel. Hormuz is still in wartime conditions, and a tanker was hit in Oman. So there is nothing good here signaling that inflation is coming down. Again, it’s not something that is going to bring the economy to its knees yet. Price action says, “I’m not very worried,” so we’re not going to be very worried about it either. But it is something worth watching because if things start to escalate, there are potential trade implications. We might look at going heavier into oil stocks or something along those lines. So keep watching, but this is not a wake-up-Monday-morning-and-sell-everything type of situation. Bonds and the Macro Regime One of the things I do want to speak about, and one of the things I said was a big deal, is bonds. That’s probably the biggest thing I’m watching right now. I would argue it is one of the most important things to be watching. We’re in a very different environment now than we were five years ago. I have the 2-year Treasury yield marked at 4.83% and the 10-year Treasury yield sitting at 5.27%. Over the past year, the 2-year yield has probably risen about 1.3 percentage points, while the 10-year has risen about 1.1 percentage points. That puts us in a bear flattener regime. We’ve got both yields rising, which is, of course, bad for bond prices. Go look at the iShares 20+ Year Treasury Bond ETF (TLT) and the PIMCO 25+ Year Zero Coupon U.S. Treasury Index ETF (ZROZ). They’ve been getting crushed. However, the shorter yield is climbing faster. In very simple terms, the bond market is pricing more pressure into the next couple of years without pricing in an equal increase in long-term economic growth. That’s not something I want to see, and it’s not something you should want to see. A 5.27% 10-year Treasury basically means that every stock now has to compete with a government bond paying more than 5%. You can absolutely own stocks when yields are this high, but the price you have to be willing to pay for those stocks has to change. The payoffs, borrowing costs, and everything else start to get flipped upside down when we’re looking at things like this. I’ve got a great image in the newsletter showing a screenshot from our website, which is updated as of October 1. The data comes in a day late, so we’re not behind. It says October 1 because that’s the day we have the most recent data for. This is generally bearish for the bond market and bearish for the stock market. Rate-sensitive assets start to have a rough time when rates get this high. We’re not seeing that specifically across the board, but we are seeing it a bit, and it’s definitely something worth paying attention to. Again, price action is not suggesting that we need to be violently worried about it. It’s simply saying: pay attention. Our Macro Models This is also in line with our own models. Our total macro indicator is still sitting at Hold, with a 0.134 rating. Negative 1 is the worst and positive 1 is the best, so we’re almost directly in the middle at this level. More interestingly, the SPY-specific indicator is still a Buy — a slight, slight, slight Buy. The rating there is 0.267. Again, positive 1 is the best and negative 1 is the worst. Gold is also a Buy at 0.326, and TLT is a Sell at -0.19. This is all in line with everything I just said in the macro discussion above. The S&P 500 has good momentum. Price action is good. Our model has it listed as a Buy right now — a slight Buy. On the bond side of the market, we’re seeing rates rise. That means you don’t really want to be investing in bonds, and our model is saying, “Hey, this is something we might be looking at selling.” We have our weekly allocations on our website, so you can go and look at those. We give a weekly allocation update. I ran a backtest on this a while ago and asked, given the way my model is constructed, how would we have traded X, Y, and Z? I think the model averaged about 8% returns per year. So it is worth paying attention to if you’re looking for very safe, slow growth. It’s a great place to watch those weekly changes. I should say that the model did roughly 8% a year with much lower volatility than the S&P 500. So there was maybe about a percentage point of underperformance, but a lot less volatility. Gold, of course, is sitting at a Buy because of inflation, oil, war uncertainties, and all of that stuff. That’s kind of your hedge. If inflation is really bad, we’re expecting certain assets to increase in value. Gold is one of those things we would expect to increase. Again, this is just stuff to pay attention to. It doesn’t mean you need to sell everything and go buy gold. If gold were sitting at positive 1 and SPY and bonds were sitting at negative 1, I would say there is something bigger to dig into here, and maybe we do need to go heavily into gold. But we’re not seeing that. I’ve got images throughout the newsletter for the total macro indicator over the past three months, and all that stuff is available on our website as well. You can find the website at thesimpleside.news, and the macro page is thesimpleside.news/macro. Buffett Indicator vs. the 2-Year Treasury I’m going to skip through a couple of the less interesting things you can check out on the website. But one of the things I don’t have on the website that I’ve included in the newsletter is something I like to watch when I see big jumps in the indicator. This is the spread between the Buffett Indicator’s predictive eight-year return and the 2-year Treasury yield. You don’t really need to understand exactly what that means. I’ve included a screenshot in the newsletter so you can read the basic information on it. Right now, that spread is -5.63 percentage points. On average, we’re seeing it at -1.61, so we’re much more negative than average. But if you look at the chart, what you’ll see is that when we get a big jump up in this indicator — when things level off at the bottom and then jump very quickly over a specific period of time — that typically signals that the market is starting to struggle and things are starting to decline. A lot of times, when you see that jump up, that’s when we’ll start to see the economy move toward a recession. You’ll see that in the image I’ve included in the newsletter. Again, a sharp reversal is what we’re looking for, and you’ll see what I’m talking about when you look at the chart. Where I Sit Right Now I know that was a lot. Stick with me. I was gone for two weeks, I had a lot to say. Basically, where I sit right now is that the ingredients are in the pot to produce a nasty sell-off. They’ve added all the ingredients: expensive stocks, rising Treasury yields, a bear flattener, oil above $100, weak hiring, and bad consumer confidence. All of that has been added into the stew. Right now, it’s just simmering. It’s simmering, but it hasn’t bubbled over, and that’s what we’re waiting for price action to show us. When it starts to bubble over, that’s when we’re going to want to turn the heat off, if you will, and get out of some of the things in our portfolios. But we haven’t seen that happen yet. Yes, things are saying that the market will fall at some point, but we’re waiting for price action to prove it to us, and then we’ll start to make moves. So stay comfortable where you’re seated right now. We have some time to watch things. We have some space. It’s not worth freaking out and blowing the lid just yet. We’ve got a little bit of time. Monthly Combined Portfolio And now we get to the good stuff: all of our portfolios and holdings. Some of these are set up and updated on the website now. Again, thesimpleside.news. You can see our live portfolios right there on the homepage, below our macro look. Let’s jump into one that I want to throw out there for everybody for free. This is the Monthly Combined Portfolio. The total return has been 353% since, I think, early-to-mid 2021. The average annual return over the past five years has been 35.17%, and the compounded annual growth rate is sitting at about 30%. So those are pretty impressive, pretty sizable returns. Let’s jump into some of the additional holdings we’ve already added for October. October Monthly Picks The first one I want to look at is Vipshop Holdings Limited (VIPS). It’s a Chinese online discount retailer selling branded apparel. One thing I want to remind you of is that we are not looking at long-term holdings when we look at the monthly portfolio. In this case, we’re looking for very, very cheap stocks according to things like their Graham Number, Peter Lynch fair value, and other valuation measures. That’s what we’re looking for here. In this case, we’re not looking for trend. Trend is not something we’re paying attention to. We’re looking for companies that have gotten very, very cheap, where they might start to attract the attention of a potential acquirer or a hedge fund that comes in and buys a lot of the company. They’re almost like special situations that are just so cheap it’s hard to ignore. Vipshop Holdings Limited (VIPS), to me, looks roughly 28%-30% undervalued across the board. When you look at its earnings power, tangible book value, projected free cash flow, price-to-sales ratio, and the Graham and Peter Lynch values, it just seems incredibly cheap. The average price target right now is $16. The stock trades at about $12. The lowest analyst projection I see for the next 12 months is $12.80. So, across the board, we’re looking at a very cheap-looking stock. Again, that’s what we do for the monthly portfolio: very cheap stocks where we’re expecting jumps in price. The next two are names we’ve had on here for a while: Velocity Financial (VEL) and Assured Guaranty Ltd. (AGO). These two companies also look incredibly cheap. We’ve seen pretty solid share buybacks at a lot of these companies. We just think there is no way these companies are going to remain this undervalued without someone taking notice, coming in, buying additional shares, and beginning to drive the price up. One company we didn’t have before that we will be adding is Woori Financial Group (WF). That’s an ADR trading on the New York Stock Exchange, and you should be able to buy it through basically any brokerage. This one does have some pretty incredible trend to it and has been doing very well. But when you go through and do a DCF — a discounted cash flow analysis — whether you do it on an earnings basis or a free-cash-flow basis, this stock has a lot of room to run. If you look at earnings power, it’s not as good, but a DCF is putting this stock at nearly 2x the current price. The average analyst price target sits at around $92. That’s not really worth putting much weight on because I think there may be only one or two analysts covering the stock, so it’s not super important. But it still looks very, very undervalued. The last one for this section, although we have a few more we’re adding as well, is Franklin BSP Realty Trust (FBRT). This has been on a constant decline since 2022. Again, we’re not looking at trend in this case because we’re not looking to buy these holdings for a long period of time. These are cheap stocks with high upside potential based on what they’re currently valued at. On a DCF basis, if you look at free cash flow, this is a company that can screen anywhere from 4x to 5x the current price, especially on free-cash-flow-based DCFs. Earnings-based, I would say it’s about on par. But across the board, when you look at projected free cash flow and things like tangible book value, it looks very, very cheap. A lot of this seems to be driven by the huge jump in revenue the company had in 2023. Revenue in 2022 was about $310 million. Revenue in 2023 was about $567 million, and it has stayed in roughly that range over the past couple of years. So we’ve seen crazy performance there, and it doesn’t seem to be valued at the level that its earnings growth reached. There are some big players that have also bought into the company. Mario Gabelli is a great guru, or super investor, who recently bought into the stock, so we’ve been paying attention to that as well. In general, those are the ones we’re interested in. We like them. There is nothing specifically, other than the trend issues I mentioned, turning us away from these stocks. Trend-Focused Monthly Picks One of the things we do is run the same system, but we specifically look for stocks that are, quote-unquote, “fitting the trend” that we like. If you look at the stocks fitting that trend, we’ve got a couple in here that look really solid and have already shown nearly 2% returns since October 1. One of those is Super Micro Computer, Inc. (SMCI). The stock is already up 4.22% since we bought it on October 1. If you look at the trend, we’ve kind of got that whole trend-is-friend thing going on with this company. Over the course of the year, it’s been pretty stagnant. It had one point where it jumped up a ton and then immediately dropped back down over the next couple of days. In general, though, it has kind of wavered and has now started to take off. It’s up 41% year to date and 112% from the low, and it seems like the trend is picking up. When you look at why it’s so undervalued, just look at the revenue growth. It’s exponential. In 2023, call it $7 billion. In 2026, roughly $39 billion. So there has been massive, explosive growth there. It looks extremely undervalued based on a couple of different measures. Specifically, if you look at the Peter Lynch value, it puts the stock at roughly 2x where it is right now — about $82 compared with a current price around $43. That’s one of the reasons we like SMCI. One of the companies we’ve had on here for a while is Reinsurance Group of America, Incorporated (RGA). That stock also looks very undervalued when you look at projected free cash flow and things like that. The stock currently trades at about $249. I would say our valuation puts it at nearly 2x that, around $473. Again, it’s one of those companies that seems to have the potential to be a massive grower if and when it catches on. That’s great for our monthly picks because that’s what we’re looking for: undervalued companies with the potential to grow massively. Another company we’re looking at is XP Inc. (XP). Same kind of story here. It’s a tech-driven financial services platform in Brazil. Trend is friend in 2026. It started off a little rough, but it has been expanding and growing quite quickly over the past couple of months. Universal Health Services, Inc. (UHS) is another one. It had a rough beginning to 2026 and is starting to pick up here. Our last one is West Coast Community Bancorp (WCCB), and this has been on a tear since 2024 — just growing, growing, growing. It was stagnant in 2025, but we’re seeing that growth start to hit again right now. We’re expecting that to continue, which is why it’s hitting our monthly picks portfolio. We’ve got a couple of other names I’m not going to dig too deeply into, but go check those out. I’ll include an image in the newsletter with all of the current holdings so you can go through them, find them, and purchase them if you’d like. We invest in these every single month. We originally weren’t going to share these picks with everybody because I try to focus on a more long-term approach, but they’re there if anybody would like to pay attention and follow them. Flagship Fund and Closing
Embed this episode
No transcript yet.