EPISODE · May 5, 2026 · 7 MIN
Harmonic Pattern EA Development Log
from daito’s Prop Firm Strategy:プロップファーム攻略の深層 · host daito|勝率40%・上位2.3%のFX/プロップ攻略
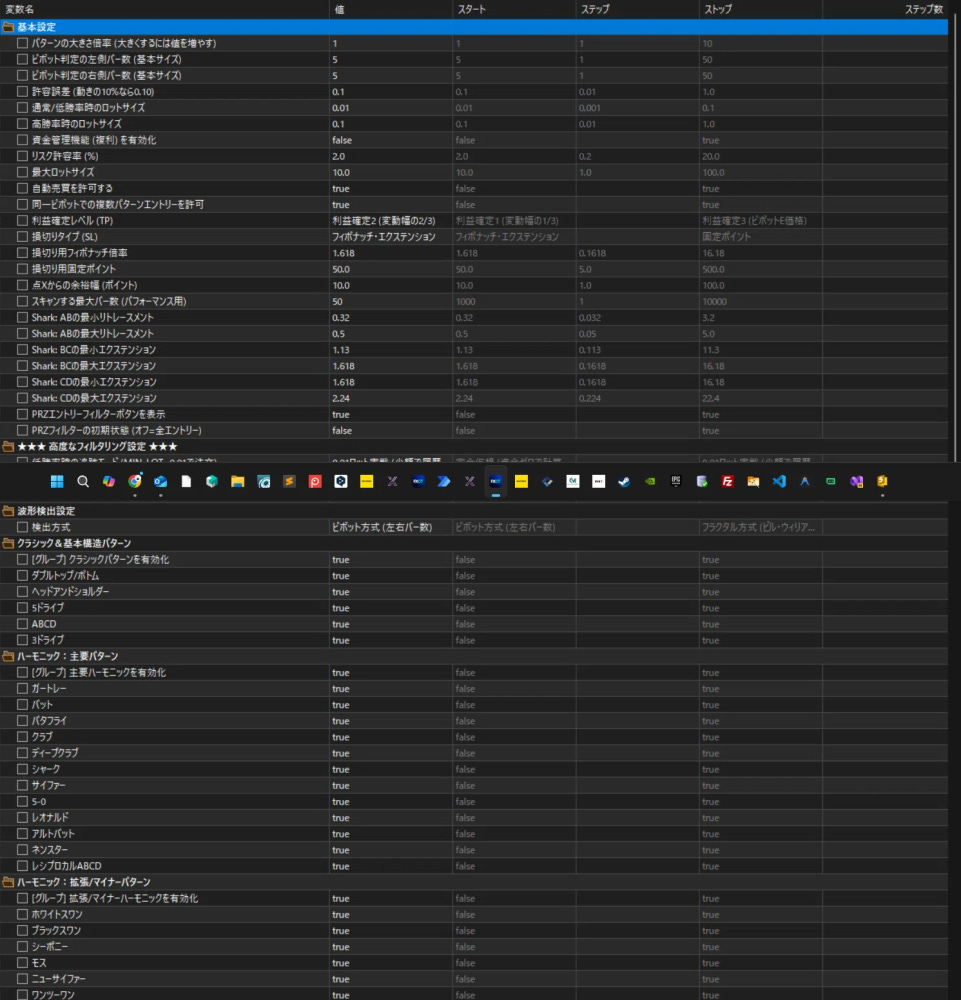
Here’s the English translation:Harmonic Pattern EA Development LogHarmonic patterns were the first analytical tool I ever fell in love with.After extensive research, I concluded: they work, but they’re difficult. More specifically, they’re well-suited for day trading and swing trading.Right now I’m developing one main strategy and a second scalping method, but alongside those I’ve been building various indicators and EAs — and this harmonic pattern EA was by far the hardest one I’ve ever made.As you can see from the settings, it detects a wide range of patterns and is capable of fully automated trading.Development was brutally difficult, and even after finishing it, the tuning process was equally brutal — which is why I couldn’t write about it for so long. But I figured I could at least share it as a development log, so here it is.I’ve been running backtests adjusted for the period from 2026 to the present.Full tick model.If the result is positive, I’ll switch to more granular candlestick data and continue refining.Assuming there’s some edge here, my next concern was trade frequency — personally, I felt it wasn’t trading enough. So I’m optimizing using the method I find most difficult and most exciting.For scalping, I’d love to see 20+ trades per day, ideally around 200. So the first step is adjusting to see if those trades can be profitable.Specifically, I’m targeting XAUUSD exclusively and aiming for 500 trades per day (full day) / 100 trades (waking hours).Of course, increasing frequency makes it harder to win.I’m looking for a workaround. This kind of side research will continue alongside my main strategy development.Things are looking considerably better! But EAs aren’t that forgiving.This is where it really begins.This is what the screen looks like during live trading.Of course, anyone who knows EA development will understand — just because it looks great on full tick doesn’t mean it’ll actually win in live conditions.That said, out of 100+ EAs I’ve built, only about 3 showed strong profits on full tick. Maybe 50+ showed decent or over-optimized results.In other words, for me, this is an incredibly rare outcome. I’ll keep researching and developing.If this works out, it would be my first ever deployable EA — since both my free-published strategy (ranked 61st in a competition) and the scalping method I’m currently building are discretionary.Having spent years in development, I fully expect more problems to surface from here. That’s just the nature of it.So whether it works or not, I’ll keep going.The early stretch of the equity curve looks dangerous though.I want to fix that section somehow, but in my experience, fixing it often kills the overall profitability — or if I add trade restrictions, it stops trading during the profitable periods. The behavior is genuinely brutal to tune.Research is the only way forward.I run through this PDCA cycle every single day. It’s a grind — honestly kind of absurd. (laughs)It’s taking way too long and showing no signs of finishing, so I’m pausing the backtest.For now, rather than changing the logic, the priority should be speeding things up. The question is: how do you make everything faster and lighter without changing any of the functionality?From experience, the heaviest part isn’t the log display — it’s the drawn pattern objects. So I’ll add an on/off toggle and disable them completely. The statistics display also has more processing overhead than you’d expect, so that goes off too.This should lighten things up considerably.Harmonic Pattern EA Development Log ② — Full Backtest Results DisclosedIn my last post, I wrote about building this EA myself.This is the continuation.After repeated adjustments, one backtest result has emerged.I’ll be honest: the numbers alone are pretty exciting.That said, this is not “finished.” If anything, the real work starts now.I’m laying everything out, including the reasons why.Backtest Conditions* Symbol: 1 pair (XAUUSD exclusive)* History quality: 100%* Model: Every tick (43,589,588 ticks)* Bars: 116,838Running on every tick. For a scalping EA, this is the most reliable testing condition available.Look at the Equity CurveFirst, look at this graph.It’s nearly a perfect upward slope.The early phase (trades 0–30,000 or so) shows gradual growth, but the angle steepens in the mid-section and accelerates strongly toward the end. The final balance is approximately ¥484,000,000.What’s especially notable about the curve’s shape is that there are almost no major collapses. There are small plateaus along the way, but no sharp drops that fail to recover. Drawdowns get absorbed by subsequent trades and the curve keeps climbing. For a high-frequency scalping EA, this is close to an ideal curve shape.Full Data BreakdownRevenueItem Value Net Profit +478,919,495 Gross Profit +1,258,906,479 Gross Loss -779,986,984 Profit Factor 1.61Net profit after subtracting gross loss is approximately ¥479M.A profit factor of 1.61 means “for every 1 unit of loss, 1.61 units are earned.” While PF 1.3+ is generally considered to indicate an edge, 1.61 is a solid level of proven edge. However — as I’ll explain — whether this translates to live markets is a separate question.DrawdownItem Value Balance Absolute DD 538,338 Balance Max DD 5,158,298 (1%) Balance Relative DD 15% (2,593,145) Equity Absolute DD 549,375 Equity Max DD 14,523,551 (16%) Equity Relative DD 17% (3,011,556)The balance-based max drawdown is just 1% — extremely small.The equity-based max drawdown, however, reaches 16%.This gap means: there are many instances where the EA carried open losses but ultimately recovered. This is common in high-frequency scalping EAs, but if you’re considering prop firm trading, equity-based drawdown is a serious concern.Firms like Fintokei often use balance-based drawdown as their benchmark, but a design that allows equity to balloon this much is a psychological and operational risk regardless. This is a key area for future adjustment.Trade Count and Win RateItem Value Total Trades 72,678 Executions 145,356 Winning Trades (Win Rate) 37,904 (52.15%) Losing Trades (Loss Rate) 34,774 (47.85%) Short 36,624 (52.34%) Long 36,054 (51.97%)72,678 total trades. The nearly identical win rates for short and long (52.34% vs 51.97%) shows this isn’t a directionally biased design — the edge comes from the patterns themselves.Win rate is 52.15% — nearly 50/50. The reason this still produces a PF of 1.61 comes down to the average profit vs. average loss:Item Value Largest Winning Trade 5,409,405 Average Winning Trade 33,213 Largest Losing Trade -109,533 Average Losing Trade -21,318Average win is about 1.56× the average loss. Even at near-coin-flip win rates, a loss-small/profit-large structure keeps the overall result positive.Win/Loss StreaksItem Value Max Consecutive Wins (Amount) 44 (1,673,705) Max Consecutive Losses (Amount) 33 (-293,274) Max Consecutive Profit (Count) 10,162,106 (9 trades) Max Consecutive Loss (Count) -356,760 (14 trades) Avg Consecutive Wins 5 Avg Consecutive Losses 533 consecutive losses sounds scary at first, but the total loss across those 33 trades was only -293,274 — roughly 8,900 per trade on average. That’s the result of proper lot management.It’s also interesting that both average win and loss streaks are 5. This suggests wins and losses tend to cluster rather than alternate — a pattern worth understanding.Other MetricsMetric Value Interpretation Expected Payoff 6,589.61 Average expected value per trade. Positive = edge exists Sharpe Ratio 27.77 Risk-adjusted return efficiency. 1+ is good; 27 is exceptional Margin Level 504.73% Balance-to-margin ratio. Higher = safer Z-Score 446.66 (99.74%) Statistical significance of win/loss patterns. 99.74% = almost certainly not random LR Correlation 1.00 Linearity of equity curve. 1.00 = near-perfect upward slope Recovery Factor 32.98 Recovery strength from drawdown. 10+ is considered excellent AHPR / GHPR 1.0001 (0.01%) Average/compound growth rate per trade LR Standard Error 3,661,296,902 Deviation from trend line — evaluated relative to the scale of the curveA Sharpe ratio of 27.77 is something you almost never see in discretionary trading. High-frequency scalping tends to inflate this metric since individual trade risk is small and diversified — but even accounting for that, the curve’s stability is high.Z-Score 446.66 (99.74%) indicates the win/loss patterns are statistically significant. It’s not random noise — it’s evidence that the harmonic pattern logic has some real, consistent function.Honest Assessment: Does This Pass?Bottom line: “Interesting result, but too early to trust fully.”What’s good:* Clean upward equity curve* Balance drawdown as low as 1%* Recovery factor of 32.98 — high resilience* LR Correlation of 1.00 — near-linear growthProblems, stated honestly:① Equity drawdown reaches 16–17% Balance-wise it’s excellent at 1%, but in live trading, watching equity drop 16% while in open positions is psychologically brutal. Some prop firms also use equity-based drawdown as their threshold, making this a real risk.② Spread and slippage in reality The backtest accounts for spread, but in real high-frequency scalping, slippage (execution delay/fill deviation) is unavoidable. Across 72,678 trades, even tiny slippage per trade compounds dramatically and can drastically change the outcome.③ Coverage of backtest period 116,838 bars on every tick is a solid condition, but the reliability depends on whether this period includes diverse market types — strong trends, ranges, and sudden volatility. Testing across longer periods and different market environments is essential.Next StepsThree current priorities:① Compress equity drawdown Adjust lot sizing and position limits to keep equity-based drawdown under 10%.② Simulate with slippage included Assess how much the numbers degrade under live-trading-like conditions. The key question: if PF drops from 1.61 to the 1.2 range, does the edge hold?③ Move to forward testing Once I have reasonable confidence from backtesting, I’ll start forward testing on a demo account and document where the divergence from backtest results begins to appear.What Building This EA Made Me ThinkWhen I was trading harmonic patterns manually, I kept running into the same wall: “It’s impossible to monitor every currency pair simultaneously when a pattern appears.”Building an EA solved that problem.But it created a new one.“Can I actually trust the signals the EA gives?”No matter how good the backtest numbers look, the moment a live trade starts running a large open loss, you face a real decision: stop it, or let it ride. The moment emotion enters that decision, the whole point of using an EA is undermined.I built the EA to remove the emotion of discretionary trading — and now I need emotional discipline just to use the EA properly.It’s a bit ironic, but that’s also what makes EA development genuinely interesting.I’ll keep tuning and report back.With that, I’m switching from full tick to real tick for the next backtest run.The results are below.In short — strong numbers, but understand that real tick results can diverge significantly from full tick. This is the most important thing to grasp.For those who haven’t built or worked with EAs, the difference might not seem significant. But this is actually the most critical wall.Whether you can push through here to profitability or not is the hardest challenge in EA development — and most EA developers sidestep it by switching to longer timeframes and swing trading.How to break through this wall is the question I’m still working on.This is where hope and despair collide in EA development.Optimization and verification continue.ハーモニックパターンEA【開発ログver.2】ハーモニックパターンは私が最初に好きになった分析ツールです。色々研究した結果、使えるが難しい。更にいうとデイトレやスイングトレードには向いている。しかし、現在1つの手法と2つ目のスキャ手法を開発しているのですが、それとは別にいろんなインジケーターやEAを作っており、その中でも一番難しかったEAです。設定を見てもらえれば分かる通り多くのパターンを検知し、自動トレードが可能。開発はゲキムズ難易度でしたが、いざ作ってみるとその後の調整もゲキムズでなかなか記事にできない代物でしたが、開発ログを公開するという視点でなら公開できるなと感じて公開しました。一旦調整して2026年から現在でバックテストしています。全ティック。 プラスならローソク足の細かな動きに変更し更に調整していきます。ある程度優位性はあるとして、今度は取引回数が個人的に少ないと感じました。私が一番難しくて一番やりたい方法で最適化します。スキャルピングで1日20回以上で200回くらい取引してくれた嬉しいなと考えているのでまずはこの取引でプラスになるか調整。具体的には、XAUUSDに特化して、1日500回(全日)/ 100回(起きている時間)に調整します。高頻度にするともちろん勝てなくなります。ここの抜け道がないか探っています。 メイン手法以外にもこのような外伝研究も引き続き行っていく行きます。だいぶ良くなってきました! ですが、EAはそんなに甘くないんですよね。ここからです。実際のトレード中の画面はこんな感じ。もちろん、分かる人にはわかるのですが、全ティックなので本当に勝てるかどうかは別問題です。しかし、全ティックでも大きく勝てていたEAは100以上作って3つくらい。あとは微妙なものや過剰最適化でなら50以上。つまり、私にとっては激レア結果です! 引き続き研究開発をしていきます。もしうまく行けたら、無料公開の大会61位の手法と今作ってるスキャル特化手法はどちらも裁量なので、初めて運用できるEAが作れるかもしれません。本当に年々も開発しているので全然ここからだめだった問題はたくさん出てくるのは当然かと。なので、だめでもうまく行っても引き続き研究していきます。ですがこの前半辺りは危ないですね。ここをどうにか修正したいのですが、おそらく経験上ここを修正すると一気にプラスにならないかのせいも高まったり取引制限をすると利益が出ているところでトレードしなくなったりとほんとゲキムズ挙動をします。研究あるのみ。こんなことをPDCAサイクルをひたすら毎日繰り返すという苦行をしています。笑ちょっと長すぎて全然終わる気配がないので一旦停止。一旦、ロジックを変更せず、スピードを上げる施策のほうが先ですね。 すべての機能を変えずに処理を早くし軽くする方法は? おそらくログ表示機能よりも経験上描画するパターンのオブジェクトなどが一番重いので一旦オンオフできるようにし完全にオフ、統計データの表示も意外と処理があるのオフ。これを実行すればある程度軽くなるかと。ハーモニックパターンEA開発ログ②|バックテスト結果を全部さらす前回の記事でEAを自作したことを書いた。今回はその続きだ。調整を重ねた結果、一つのバックテスト結果が出た。正直に言う。数字だけ見るとかなり面白い結果になった。ただし、これで「完成」ではない。むしろここからが本番だ。その理由も含めて、全部さらす。バックテスト条件* 銘柄: 1銘柄(XAUUSD特化)* ヒストリー品質: 100%* モデル: 全ティック(43,589,588ティック)* バー数: 116,838本全ティックで回している。スキャルピング系EAの検証としては、これが最も信頼性が高い条件だ。損益曲線を見てほしいまずこのグラフを見てほしい。ほぼ完璧な右肩上がりだ。序盤(トレード数0〜3万回前後)は緩やかな上昇だが、中盤以降から角度が上がり、後半にかけてぐんぐん伸びている。最終残高は約4億8,400万。グラフの形として特筆すべきは、大きな崩れがほぼないことだ。途中に小さな踊り場はあるが、急落してそのまま回復しない場面が見当たらない。ドローダウンが出ても次のトレードで吸収しながら伸び続けている。スキャルピング高頻度系EAとして、これは理想的な曲線に近い形だ。詳細データの全解説収益まわり項目 数値 総損益 +478,919,495 総利益 +1,258,906,479 総損失 -779,986,984 プロフィットファクター 1.61総利益と総損失の差し引きで約4億7,900万のプラス。プロフィットファクター1.61とは「1の損失を出す間に1.61を稼いでいる」という意味だ。一般的にPF1.3以上で優位性ありと言われる中で、1.61はしっかり優位性が出ている水準だ。ただし後述するが、これが現実の相場でそのまま出るかは別の話になる。ドローダウン項目 数値 残高絶対ドローダウン 538,338 残高最大ドローダウン 5,158,298(1%) 残高相対ドローダウン 15%(2,593,145) 証拠金絶対ドローダウン 549,375 証拠金最大ドローダウン 14,523,551(16%) 証拠金相対ドローダウン 17%(3,011,556)残高ベースの最大ドローダウンは1%。これは非常に小さい。一方、証拠金ベースの最大ドローダウンは16%まで膨らんでいる。この乖離が意味するのは、「含み損を抱えながらも最終的には回収できている局面が多い」ということだ。スキャルピングの高頻度EAでは起きやすい現象だが、プロップファームでの運用を考えると、証拠金ベースのドローダウンは要注意ポイントになる。Fintokeiのような審査では残高ベースのドローダウンが基準になることが多いが、それでも証拠金側が膨らむ設計は、精神的にも運用的にもリスクになる。ここは今後の調整課題だ。トレード回数と勝率項目 数値 取引数 72,678回 約定数 145,356 勝ちトレード(勝率) 37,904回(52.15%) 負けトレード(負率) 34,774回(47.85%) ショート 36,624回(52.34%) ロング 36,054回(51.97%)取引数72,678回。これだけの回数でショートとロングの勝率がほぼ均等(52.34% vs 51.97%)なのは、特定の方向に偏った設計ではなく、パターンそのものに優位性があることを示している。勝率は52.15%。ほぼ五分五分に見えるが、これがプロフィットファクター1.61を生み出せているのは平均の損益の差にある。項目 数値 最大 勝ちトレード 5,409,405 平均 勝ちトレード 33,213 最大 負けトレード -109,533 平均 負けトレード -21,318平均の勝ちが負けの約1.56倍。勝率が五分五分でも、損小利大の形が成立しているから全体がプラスになっている。連勝・連敗の記録項目 数値 最大 連勝数(金額) 44回(1,673,705) 最大 連敗数(金額) 33回(-293,274) 最大 連勝利益額(数) 10,162,106(9回) 最大 連敗損失額(数) -356,760(14回) 平均 連勝(数) 5回 平均 連敗数 5回最大連敗が33回というのは一見怖く見えるが、その33回での損失合計が-293,274にとどまっている。1回あたり平均で約8,900の損失。これがロット管理の結果だ。平均の連勝・連敗がともに5回というのも興味深い。勝ちと負けが交互に来るのではなく、ある程度まとまって来る傾向があることがわかる。その他の指標項目 数値 読み方 期待利得 6,589.61 1トレードあたりの平均期待値。プラスは優位性あり シャープレシオ 27.77 リスクに対するリターンの効率。1以上で良好。27は高水準 証拠金維持率 504.73% 証拠金に対する残高の余裕度。高いほど安全 Z-Score 446.66(99.74%) 連勝・連敗の統計的有意性。99.74%はほぼ偶然ではないことを示す LR Correlation 1.00 損益曲線の直線性。1.00はほぼ完璧な右肩上がり リカバリファクター 32.98 ドローダウンからの回復力。10以上で優秀とされる AHPR / GHPR 1.0001(0.01%) 1トレードあたりの平均・複利成長率 LR Standard Error 3,661,296,902 損益曲線のブレ幅。曲線の規模に対して相対的に評価するシャープレシオ27.77は通常の裁量トレードではまず見ない数値だ。高頻度スキャルピングの特性上、1回の損益は小さくリスクが分散されるため、この数値が高くなる傾向はある。ただそれを差し引いても、損益曲線の安定性は高い。Z-Score 446.66(99.74%)は、勝ち負けのパターンが統計的に有意であることを示している。単なるランダムな結果ではなく、ハーモニックパターンという根拠が一定機能していることの裏付けにはなる。正直な評価:これは「合格」か結論から言う。「面白い結果だが、まだ信用するには早い」というのが正直なところだ。良い点はこれだけある。* 損益曲線が綺麗な右肩上がり* 残高ドローダウンが1%台で浅い* リカバリファクター32.98と回復力が高い* LR Correlation 1.00という直線的な成長ただ、問題も正直に書く。① 証拠金ドローダウンが16〜17%に達している残高ベースでは1%と優秀だが、含み損の段階で証拠金が16%まで減っている局面がある。リアル口座でこれが起きると精神的にきつい。また、プロップファームによっては証拠金ドローダウンが基準になるケースもある。② スプレッドとスリッページの現実バックテストはスプレッドを加味しているが、リアルの高頻度スキャルピングではスリッページ(約定ズレ)が無視できない。72,678回のトレードで1回あたりわずかなスリッページが積み重なるだけで、結果は大きく変わる。③ バックテスト期間のデータ量116,838本のバーで全ティック検証と条件は良いが、相場の種類(強トレンド・レンジ・急変動)がこの期間にどれだけ含まれているかで信頼度は変わる。より長い期間・異なる相場環境でのテストが必要だ。次のステップ現時点での課題は3つだ。① 証拠金ドローダウンの圧縮 証拠金ベースのドローダウンを10%以内に抑えるためのロット管理・ポジション上限の調整を行う。② スリッページを加味したシミュレーション リアル口座に近い条件でどこまで数値が落ちるかを確認する。PFが1.61から1.2台に落ちても優位性が保てるかが焦点だ。③ フォワードテストへの移行 バックテストで一定の確信が持てたら、デモ口座でフォワードテストを開始する。バックテストとフォワードの乖離がどこで出るかを記録していく。このEAを開発して思うことハーモニックパターンを裁量でやっていた頃、私は「このパターンが来たときに、全部の通貨ペアを同時に監視するのは無理だ」と何度も感じた。EAにすることで、その問題は解決した。ただ、新しい問題が出てきた。「EAが出したシグナルを信じ切れるか」という問題だ。バックテストでどれだけ良い数字が出ても、リアルで含み損が膨らんでいる瞬間に「止めるべきか続けるべきか」という判断を迫られる。そこで感情が入ったら、EAを使う意味が半減する。裁量の感情をなくすためにEAを作ったのに、EAを使うための感情管理が必要になる。なかなか皮肉な話だが、これがEA開発の面白いところでもある。引き続き調整を続けて、また報告する。前回の記事はこちら → ハーモニックパターン自作EA化した話。スキを押してもらえると次の開発ログを書く励みになります。 フォローしてくれると、EA開発の続報と、FXで生き残るための話をお届けします。だがこの状態でリアルティックに切り替えてバックテストを行います。 結果はこちら。つまり、かなり良い結果ですが、ここのリアルティック次第で大きく変わるということを覚えておいてほしい。EA開発やEAを触ったことがない人にとってはそれほどの千賀はないと感じるかもですが実はここが一番重要です。ここからプラスにできるかできないかが一番難しい壁で多くのEA開発者は時間を長くするスイングに切り替えることで解決しています。ここをどう乗り越えればいいか。このように期待と絶望が交差するのがEA開発の現場です。引き続き最適化検証をしていきます。 This is a public episode. If you would like to discuss this with other subscribers or get access to bonus episodes, visit daitodaison.substack.com
NOW PLAYING
Harmonic Pattern EA Development Log
No transcript for this episode yet
Similar Episodes
Feb 24, 2026 ·13m
Feb 17, 2026 ·9m
Feb 11, 2026 ·7m
Feb 3, 2026 ·7m
Jan 27, 2026 ·8m
Jan 20, 2026 ·7m