
EPISODE · Sep 4, 2026 · 11 MIN
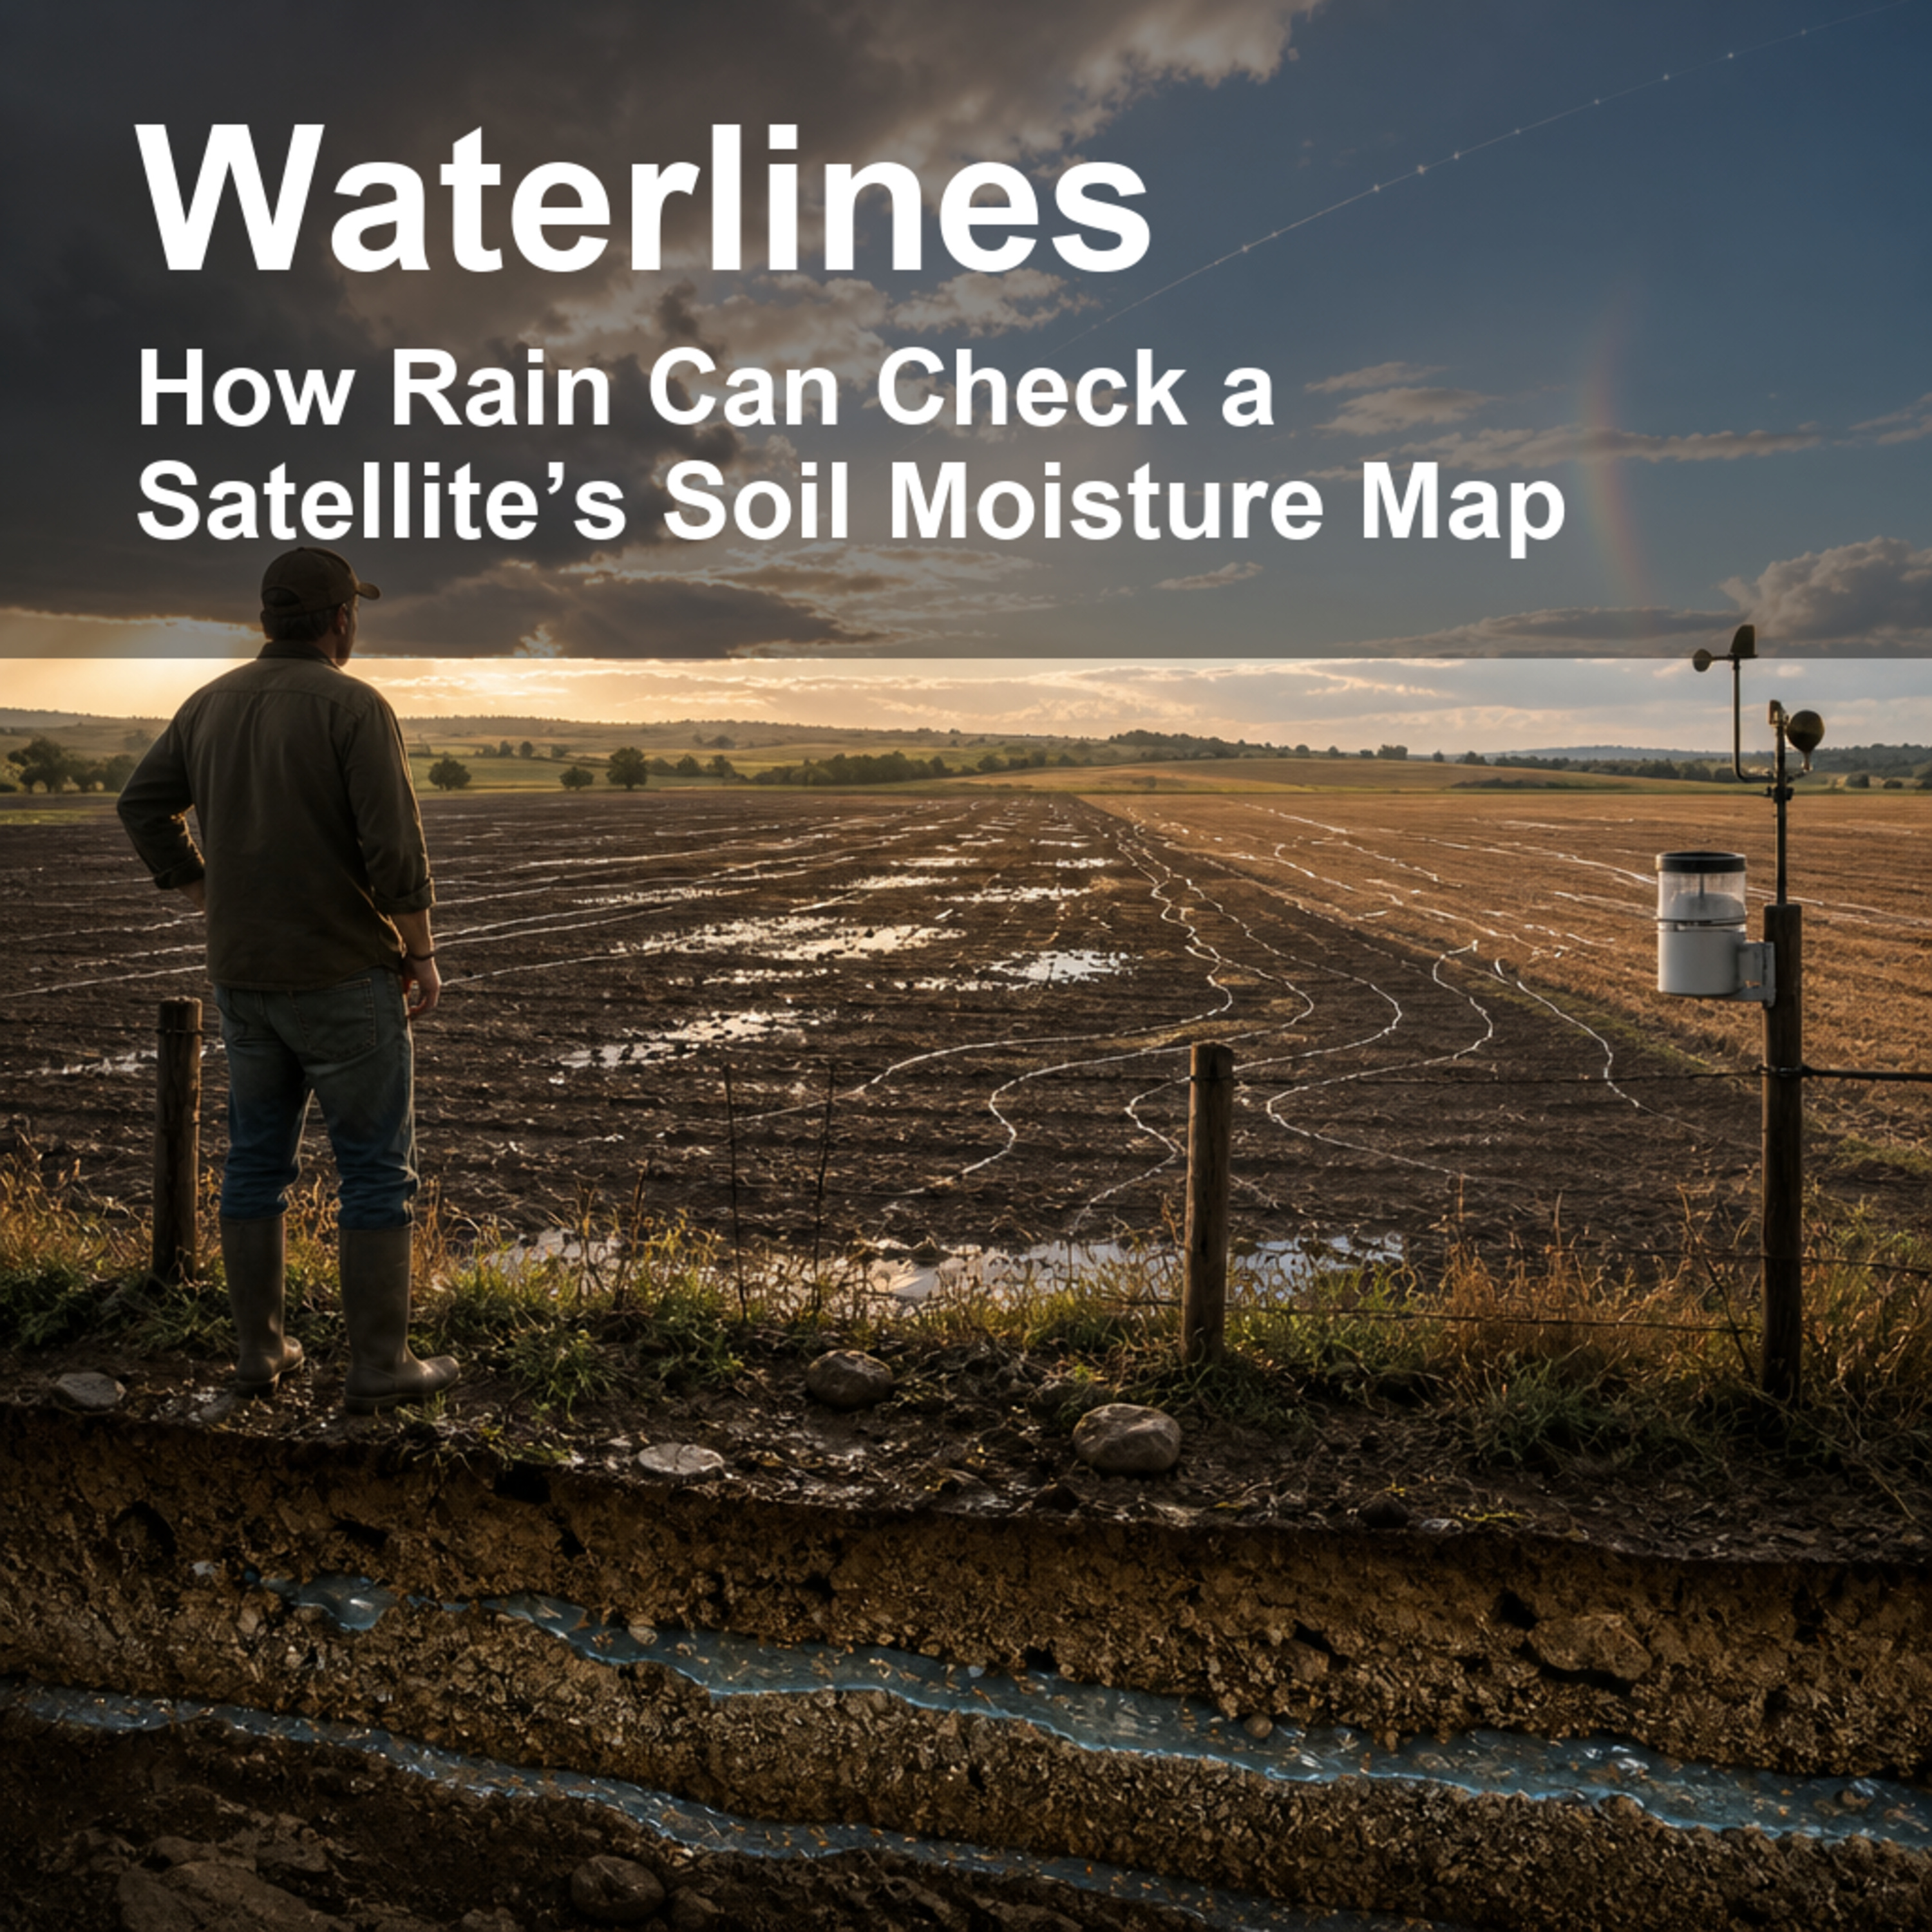
How Rain Can Check a Satellite’s Soil Moisture Map
from Waterlines: How Water Shapes Our World · host jaywen
Takeaway: A satellite soil-moisture map is more trustworthy when rainy days and wet ground line up in the pattern real soils naturally make.Flood warnings, drought outlooks, farm decisions, and climate models all depend on a deceptively simple question: how wet is the ground? Satellites can scan huge areas that no field crew could visit every day, but their soil-moisture maps are hard to check because a satellite pixel covers many kilometers while a ground sensor samples one small spot. This episode explores a clever workaround: instead of asking whether a satellite matches scattered soil probes, the researchers ask whether its wet-and-dry pattern makes sense when compared with large-scale rainfall.We unpack how soil moisture sits at the busy meeting place between rain, runoff, evaporation, plant water use, and heat. Then we follow the paper’s main idea: over time, real soils leave a recognizable fingerprint. Dry ground tends to be linked with lower recent rainfall, wet ground with higher rainfall, and the curve between them has a distinctive S-like shape because drainage, runoff, and evaporation respond differently as soils fill. If a satellite product scrambles that relationship, it may be carrying more error. The authors used a statistic called mutual information, explained here as a way to measure how much two messy datasets “know” about each other, to compare three AMSR-E satellite soil-moisture products across the contiguous United States from 2002 to 2011.The result is not one universal winner. The University of Montana product carried the most useful rainfall-linked information across about 50 percent of the region, the VUA-NASA product across about 47 percent, and the NASA product across about 3 percent. The better-performing product also depended on landscape: flatter, less vegetated areas tended to favor the University of Montana product, while more rugged or more vegetated areas often favored VUA-NASA. The study also found winter and frozen-ground behavior that needs care, reminding us that satellite data are powerful but not magic.Citation: Tuttle, S. E., & Salvucci, G. D. (2014). A new approach for validating satellite estimates of soil moisture using large-scale precipitation: Comparing AMSR-E products. Remote Sensing of Environment, 142, 207–222. https://doi.org/10.1016/j.rse.2013.12.002Disclosure: This Waterlines episode package is written for public-science listening and uses AI-generated voices.
Embed this episode
NOW PLAYING
How Rain Can Check a Satellite’s Soil Moisture Map
No transcript for this episode yet
Similar Episodes
No similar episodes found.
Similar Podcasts
No similar podcasts found.