
EPISODE · Jun 9, 2020 · 4 MIN
Sesli Yazı #12 : Serpilme Diyagramı
from Sürekli İyileştirme Yolculuğu · host Yalın Dünya
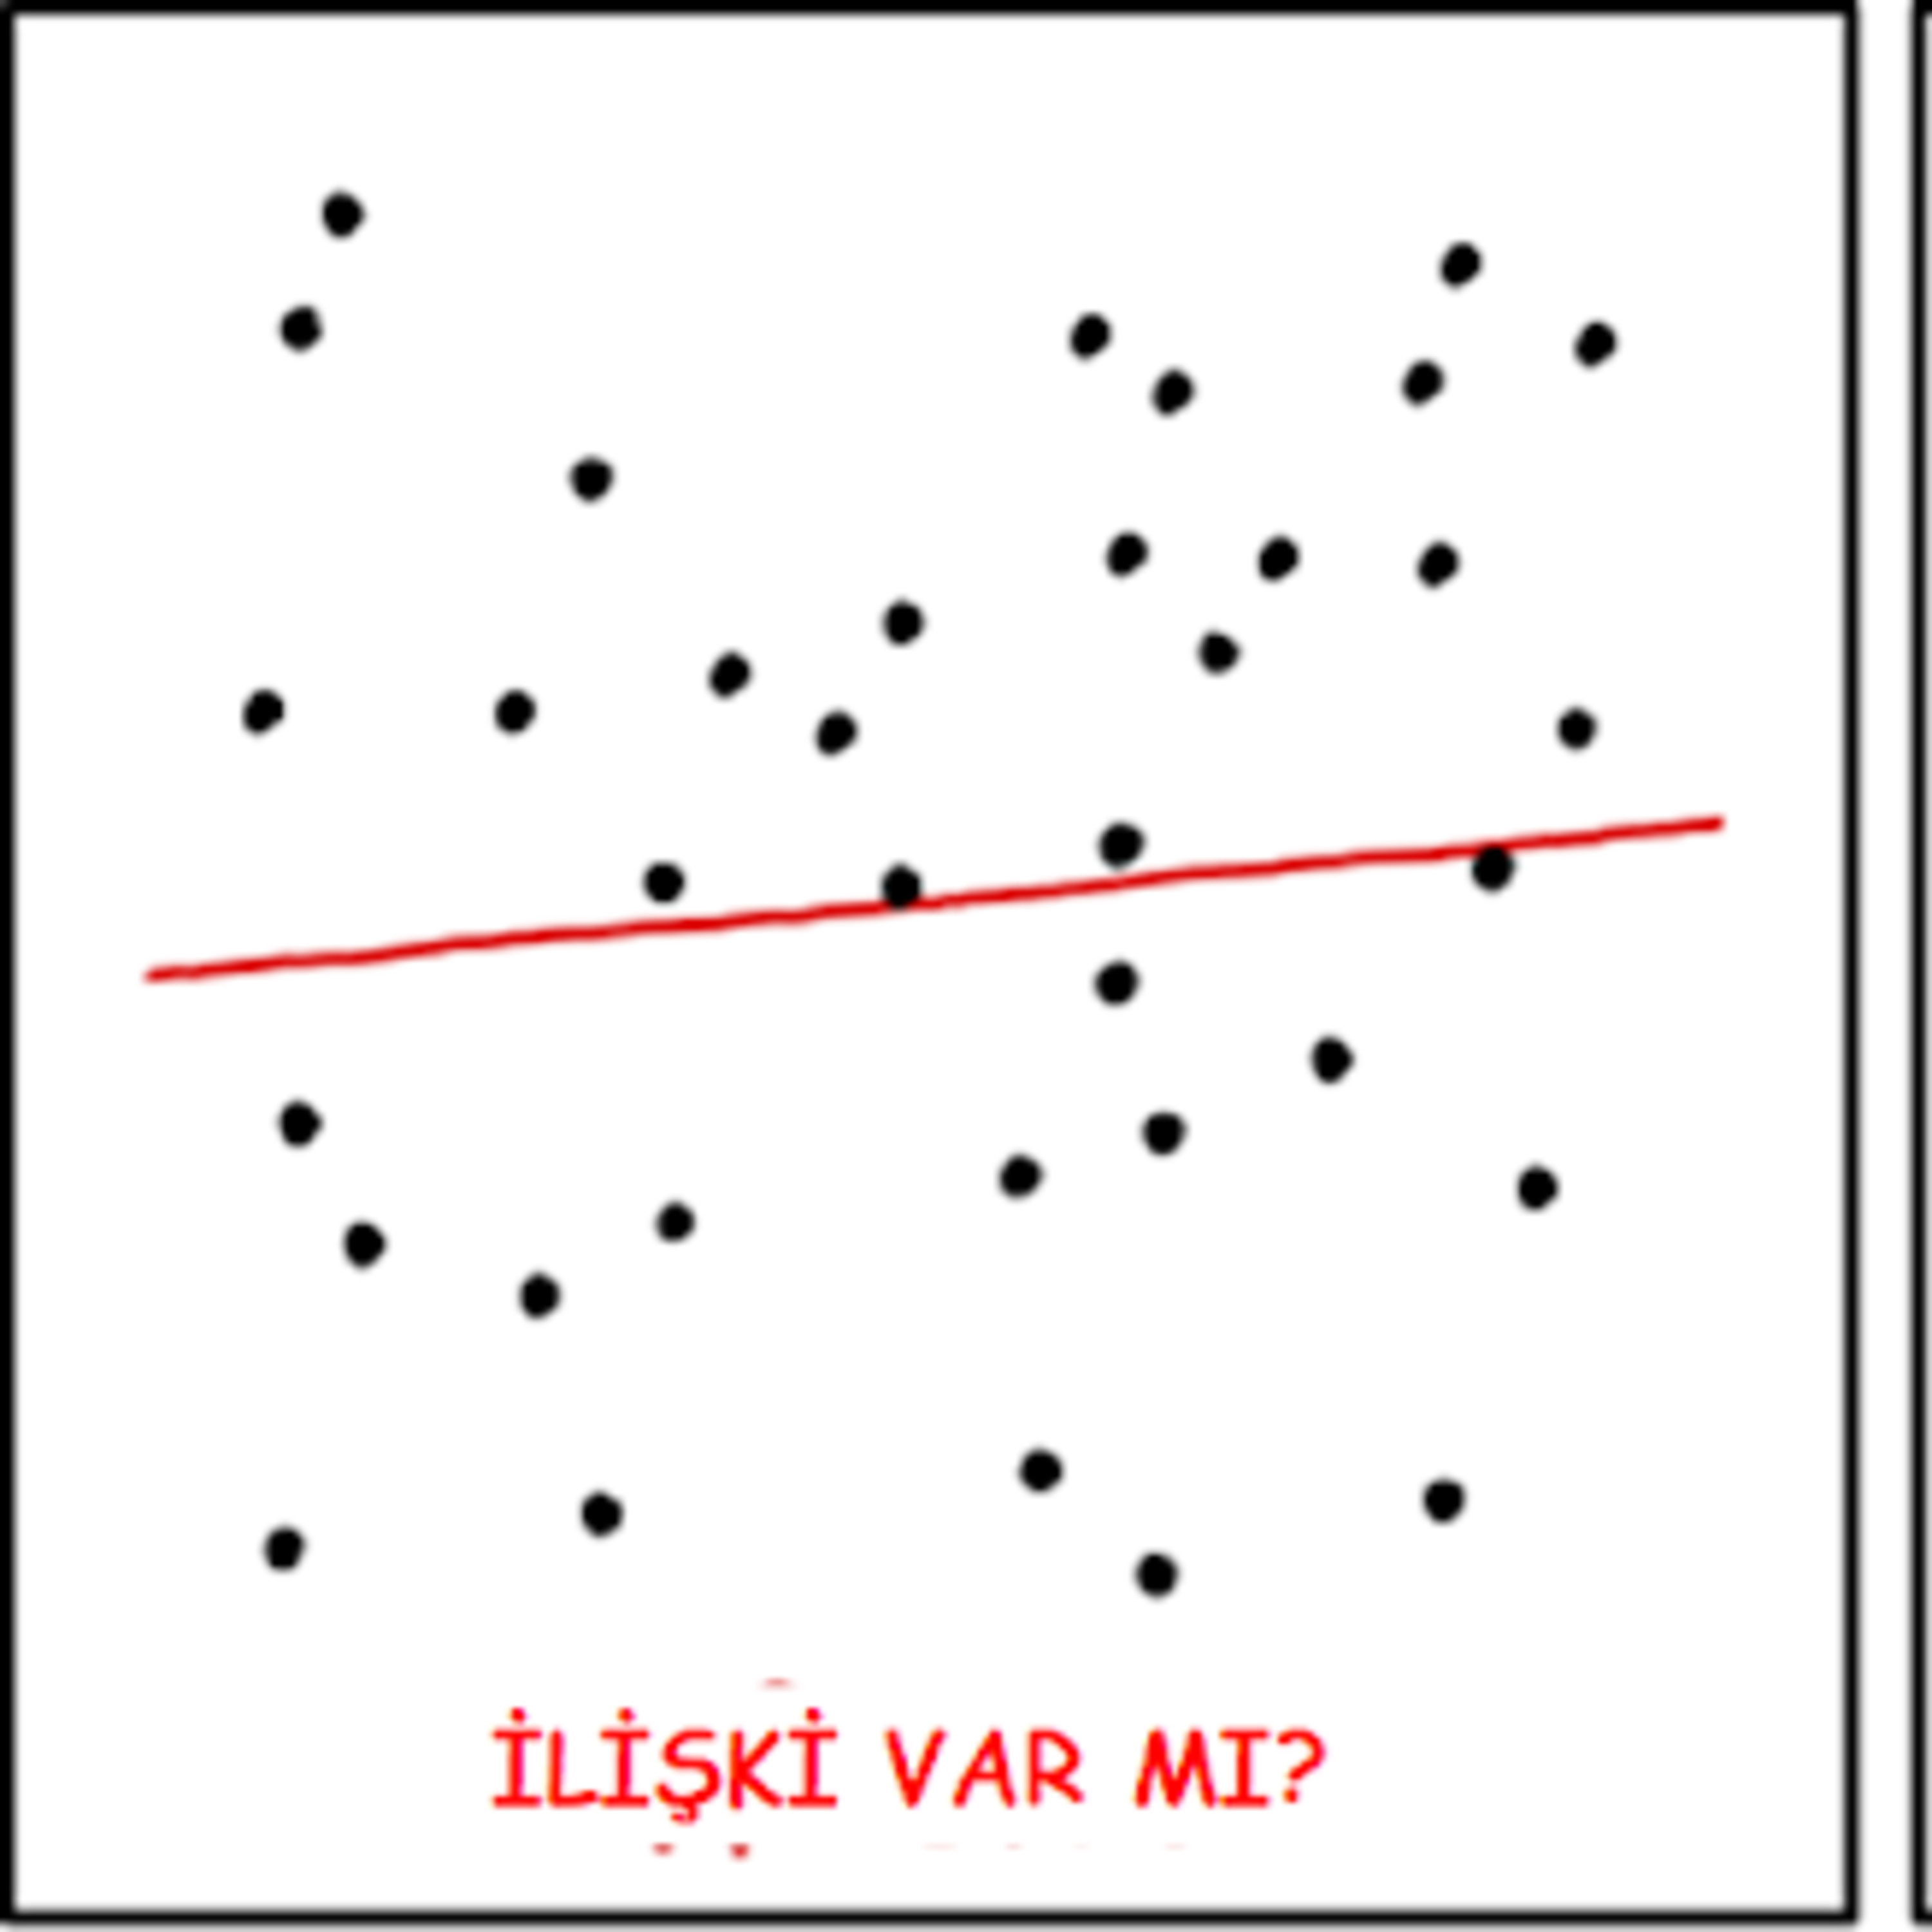
Serpilme diyagramı nedir? Nasıl kullanılır ve yorumlanır? İki farklı değişkenin arasındaki ilişkiyi belirlemek için serpilme diyagramı (scatter plot) kullanıyoruz. Bu diyagram ile ilişkinin sebebini anlayamasak da, bir ilişki olup olmadığını ya da ilişkinin ne kadar güçlü olduğunu anlayabiliyoruz. Blog yazısını okumak isterseniz bu linke tıklayın.
Embed this episode
Ready to play
Sesli Yazı #12 : Serpilme Diyagramı
0:00
4:03
1×
No transcript for this episode yet
Similar Episodes
No similar episodes found.
Similar Podcasts
Frequently Asked Questions
How long is this episode of Sürekli İyileştirme Yolculuğu?
This episode is 4 minutes long.
When was this Sürekli İyileştirme Yolculuğu episode published?
This episode was published on June 9, 2020.
Can I download this Sürekli İyileştirme Yolculuğu episode?
Yes. Use the download control on the episode player to save the publisher-provided media file.
URL copied to clipboard!